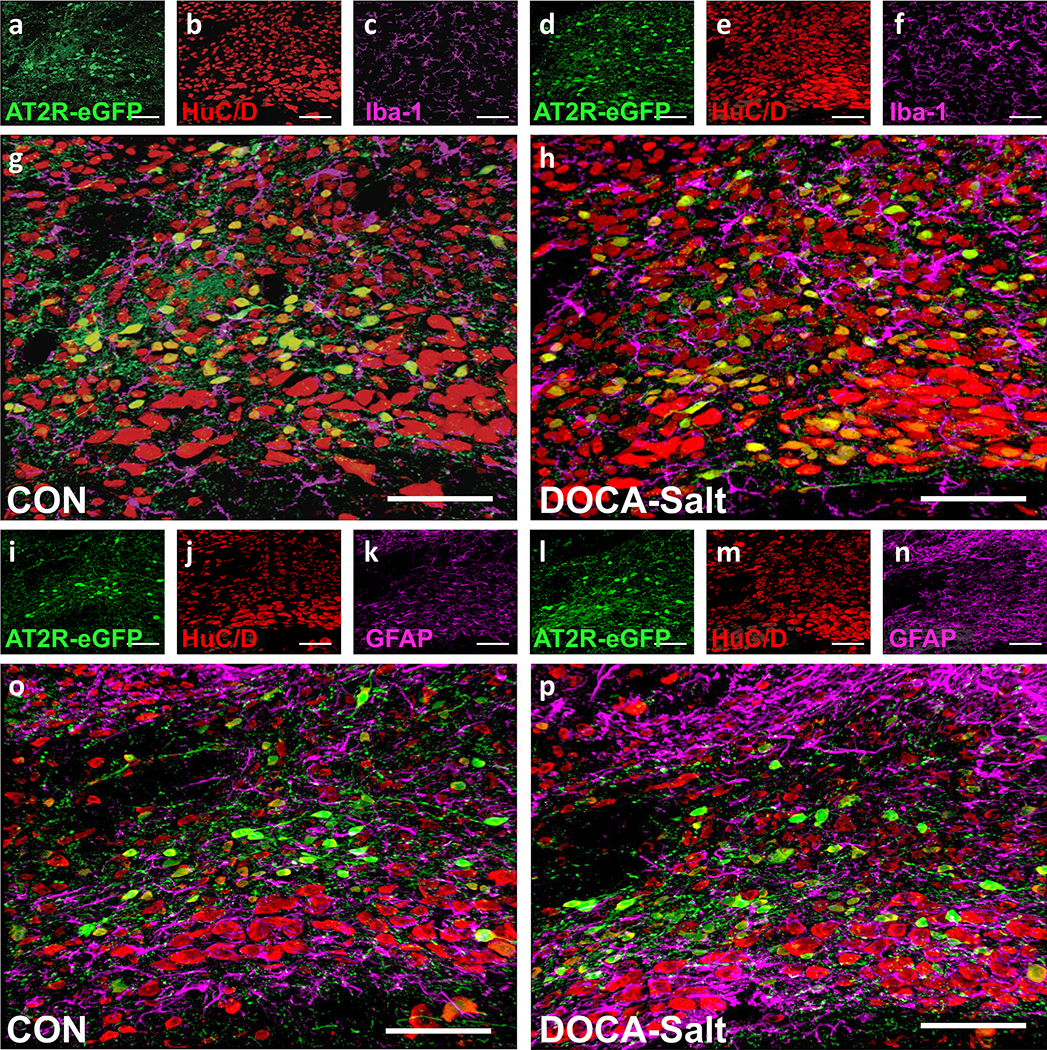
Figure 5. Cellular localization of AT2R-positive cells within the intNTS of normotensive - and DOCA-salt hypertensive mice.
Projection images through the intNTS of male control normotensive- and DOCA-salt hypertensive mice showing the location of AT2R-eGFP fluorescence (green) in relation to neurons, microglia and astrocytes.
(a-c, g) CON or (d-f, h) DOCA-salt AT2R-eGFP mice depicting eGFP (a, d), HuC/D (b, e), and Iba-1 (c, f) immunoreactivity, and the respective merged images (g, h).
(i-k, o) CON or (l-n, p) DOCA-salt AT2R-eGFP mice depicting eGFP (i, l), HuC/D (j. m), and GFAP (k, n) immunoreactivity and the respective merged images (o, p). These images are representative of 8 mice/group. Scale bars are 100 μm.

