Figure 2.
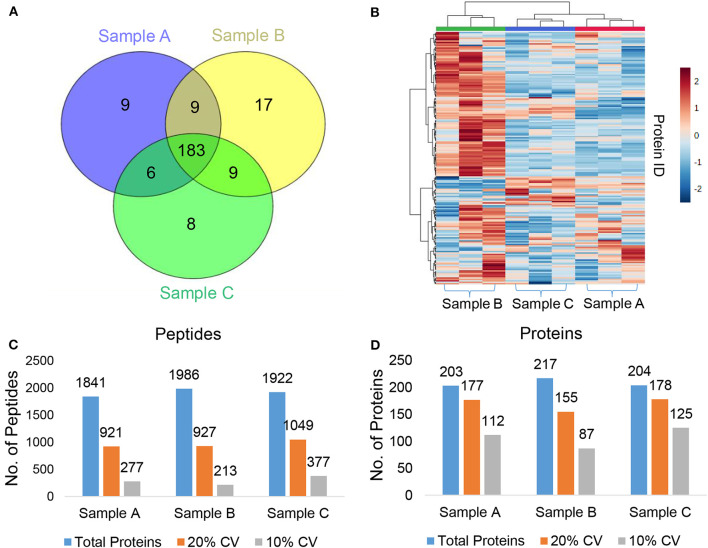
Label-free quantitation (LFQ) of plasma proteins. (A) Venn diagram representing the common and unique proteins across the different plasma samples. (B) Heatmap showing abundances of the identified proteins in each technical replicate of the three pooled plasma samples (Sample A, B, and C). (C,D) The total number of identified (C) peptides (D) proteins, no. of proteins below 20%, and 10% coefficient of variation (CV) at 1% FDR.

