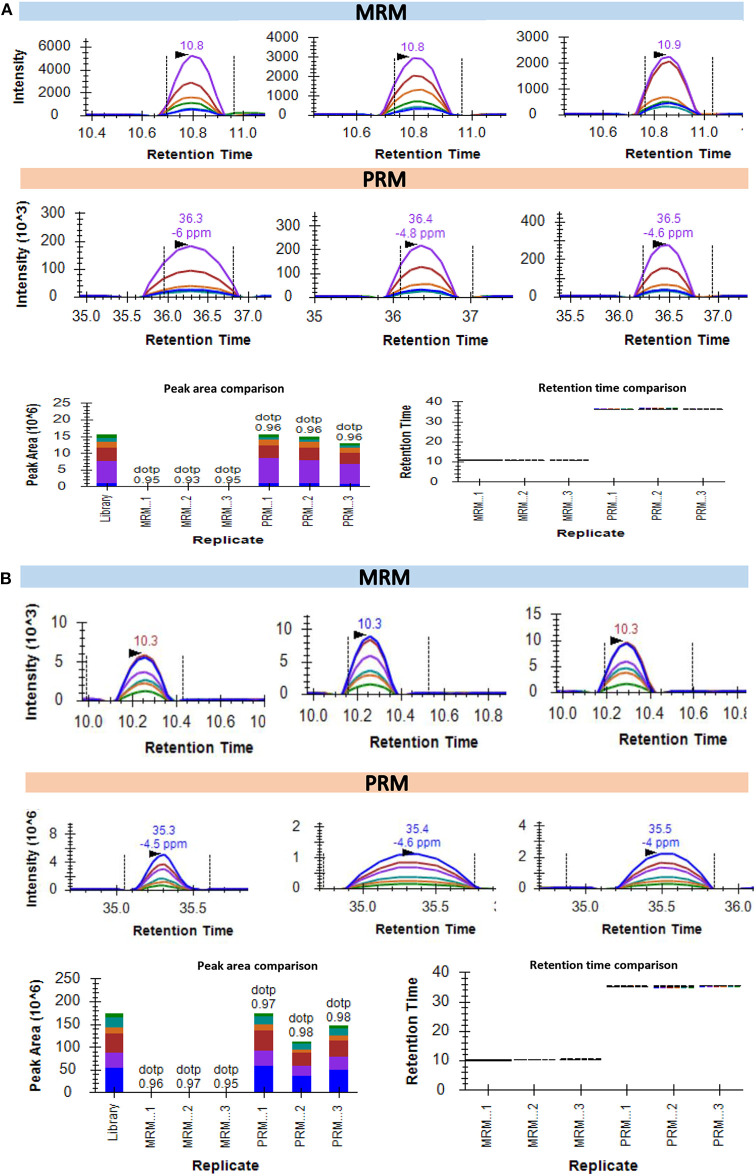
Figure 5.
Quantification of the endogenous peptides in plasma samples using targeted MS approaches. (A) Intensities of AGALNSNDAFVLK for protein Gelsolin-1 in 3 plasma samples as detected using MRM and PRM. The bottom left part of the panel represents the comparative peak areas of the peptide in each of the 3 samples using both the techniques. The bottom right of the panel shows the consistency of retention times across the biological replicates in both the techniques. (B) Intensities of SGLSTGWTQLSK for protein Alpha-1B-glycoprotein in 3 plasma samples as detected using MRM and PRM. The bottom left part of the panel representing the comparative peak areas of the peptide in each of the 3 samples using both the techniques. The bottom right of the panel shows a comparative analysis.

