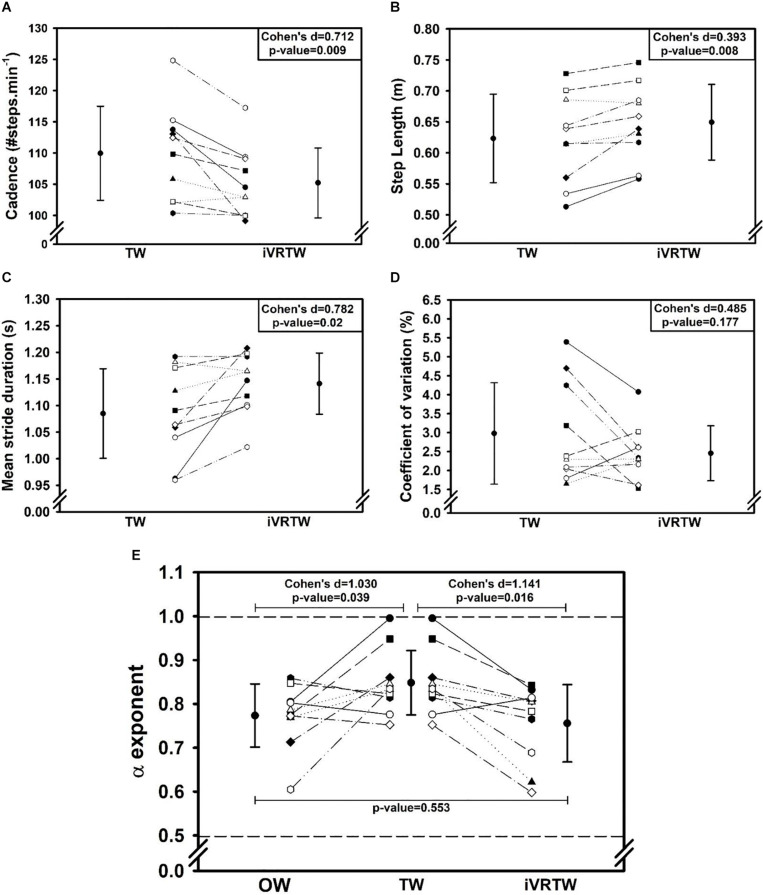
FIGURE 1.
Graphs showing mean (±1 SD) and individual gait parameters values assessed during Overground Walking [OW, only graph (E)], Treadmill Walking (TW), and immersive Virtual Reality on Treadmill Walking (iVRTW) conditions. (A) Cadence graph. (B) Step length graph. (C) Mean stride duration graph. (D) Coefficient of variation graph. (E) α exponent graph (dashed lines corresponding to the limits between which there are LRA).

