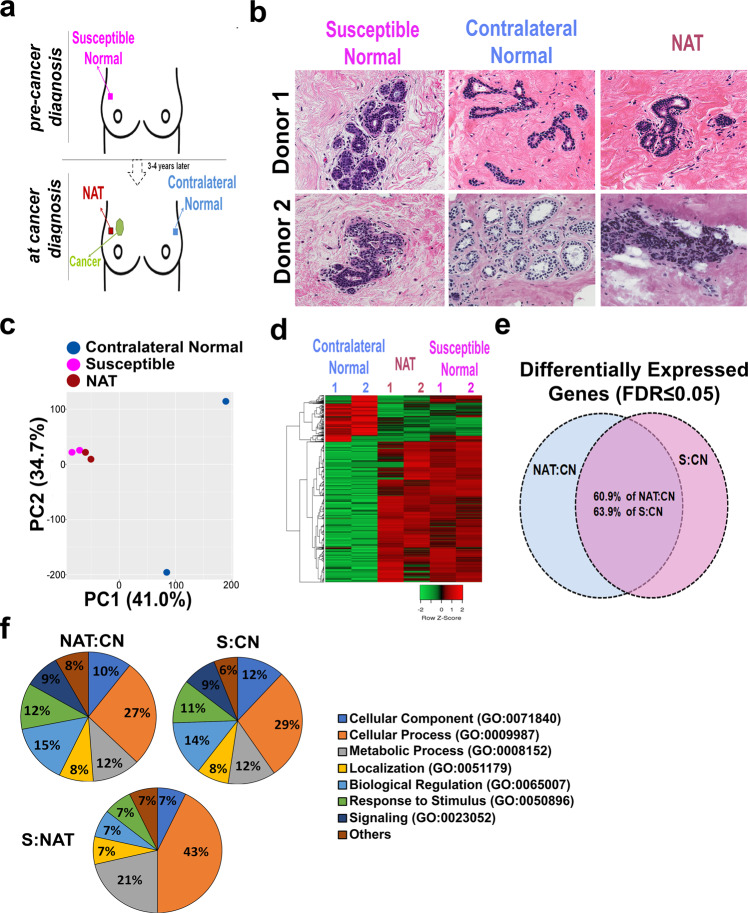
Fig. 1. Transcriptomic analysis of paired contralateral normal, normal adjacent to the tumor (NAT), and susceptible microdissected breast epithelial samples.
a Descriptive design of the collection of susceptible, NAT, and contralateral breast tissue cores. Breast tissue cores were collected from the upper-outer quadrant. b Hematoxylin and eosin staining of tissue sections from contralateral normal, susceptible, and NAT breast specimens. Images at ×40 magnification are shown. c Principal component analysis of the transcriptomic profiles from contralateral normal (blue), adjacent normal (purple), and susceptible (pink) breast epithelium showed a clear separation of the NAT and susceptible from the contralateral samples. d Hierarchical clustering heatmap of the differentiated transcripts between susceptible, adjacent normal, and contralateral breast tissue showed similarity between NAT and susceptible with both being highly distinct from the contralateral breast. e Venn diagram of differentially expressed genes (DEGs) in NAT vs. contralateral normal (CN) (NAT:CN) and susceptible (S) vs. CN (S:CN) showed that the two comparisons share 60.9% of DEGs in NAT:CN and 63.9% of the DEGs between S and CN. f Gene ontology enrichment analysis of differentially expressed genes between NAT and CN, S and CN, and S and contralateral normal, and susceptible and NAT breast epithelium was performed using PANTHER. Pie charts showing the percentage of the significantly enriched biological process categories against the total.

