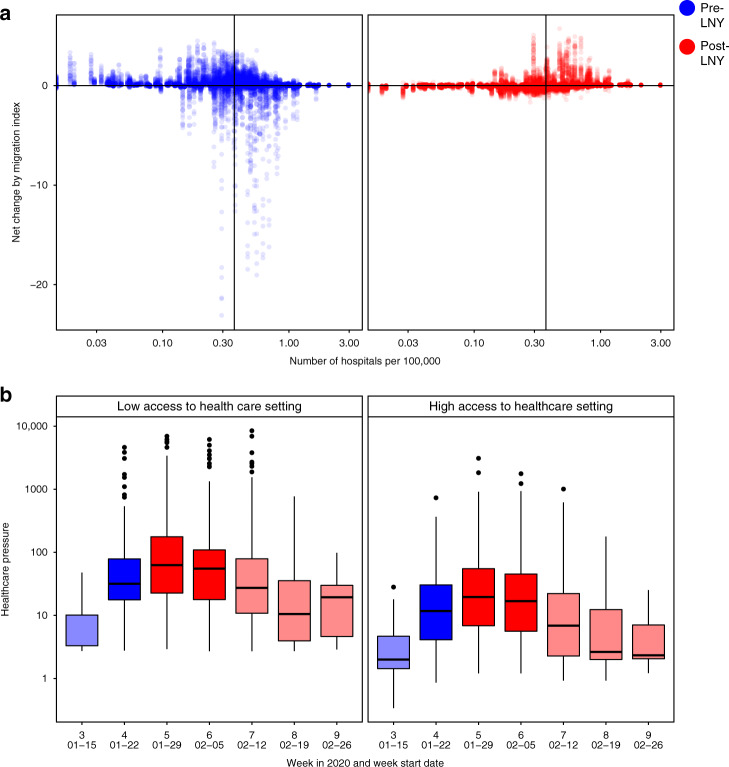
Fig. 3. Healthcare service availability and COVID-19-related healthcare pressure.
a The changes in traveller volume before (blue) and after (red) LNY. Net change is defined as inbound migration index minus outbound migration index. Thus, a negative change indicates more travellers leave than arrive while a positive value indicates more travellers arrive than leave. A solid line indicates the median level of healthcare capacity. b The changes in the healthcare pressure (log10 scale) related to COVID-19 each week in low and high healthcare capacity prefectures. Healthcare capacity is measured by the number of hospitals per 100,000 residents (nlow = 157, nhigh = 153). Healthcare pressure is measured by confirmed COVID-19 cases divided by healthcare capacity. Darker shade represents weeks when low healthcare capacity settings experienced significantly higher pressure than high healthcare capacity settings; lighter shade represents when differences are not statistically significant based on Mann–Whitney U test (5% type I error rate). The comparison for week 7 has p-value = 0.06. The boxplots in panel b display Median, IQR and whiskers +/− 1.5 times IQR.

