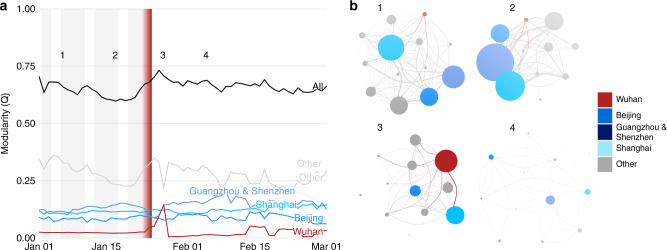
Fig. 4. Community structure of the movement network.
Community structure is measured through modularity, a metric defining the strength of connections within vs. between communities. The members of communities are determined by the Leiden algorithm20. a The time series of total and sub-community modularity, and (b) snapshots of the community networks on days before and after the cordon sanitaire. The communities for Wuhan (red) and several major cities (blues) are highlighted in a and b in both the community and edges between communities. The time series shows working week (grey bars; missing after nation-wide social distancing measures), as well as the initiation and enforcement of restrictions in Wuhan (red gradient) over 23rd to 24th January. The communities (circles) are sized according to within-community migration index, while their connections are sized according to their between-community migration index.

