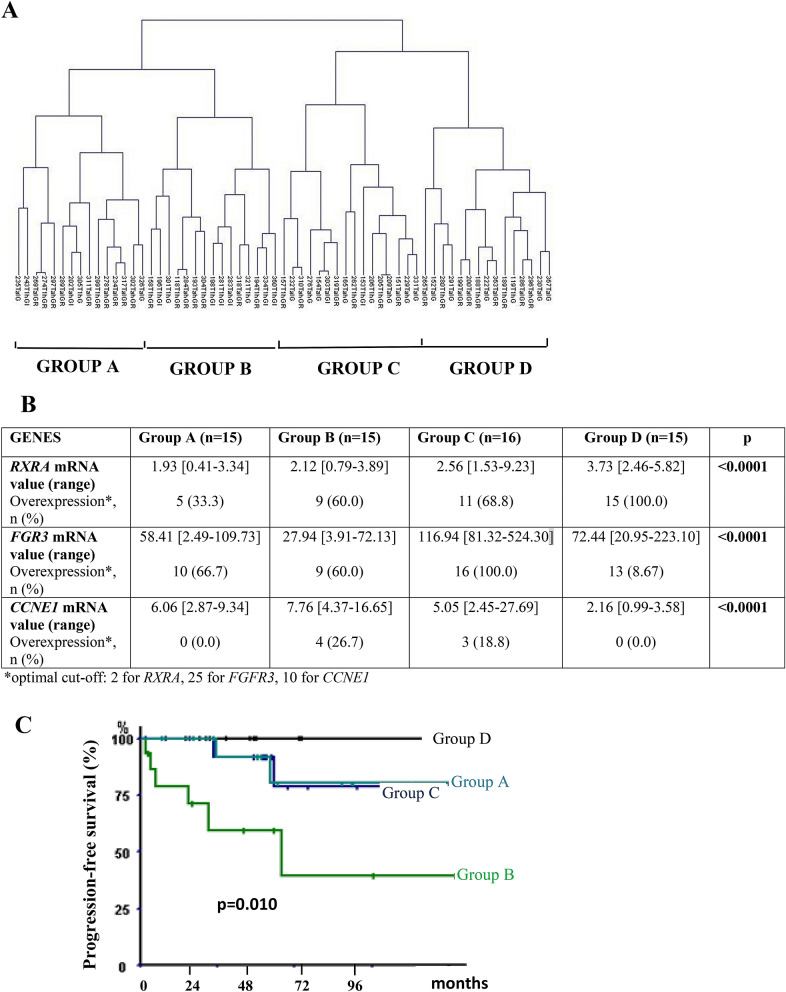
Figure 1.
Supervised classification analysis of the 61 NMIBC tumor samples with the 3-gene signature comprising RXRA, FGFR3 and CCNE1. (A) dendrogram of four tumor groups obtained by hierarchical cluster with the 3-gene signature. (B) mRNA median value [range] and overexpression rates of FGFR3, RXRA and CCNE1 in the four tumor groups. p value calculated by Kruskal Wallis H-test. For each gene, mRNA values ≥ optimal cut-off were considered to represent overexpression and ≤ optimal cut-off, underexpression. (C) Kaplan–Meier curves comparing progression-free survival for tumor groups. p value calculated by log rank test.

