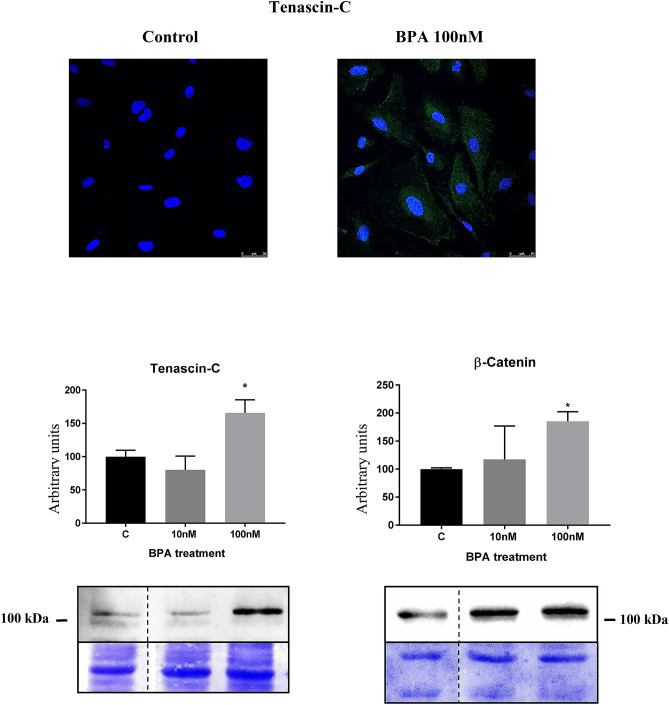
Figure 4.
BPA treatment originated an increase in the protein expression of tenascin-C and β-catenin. Data are the means ± SEM of three different experiments, each performed in duplicate. *p < 0.05 using ANOVA test. Due to BPA modified the housekeeping proteins (actin, tubulin, etc.) we used coomassie-blue staining to normalized total protein amount. Discontinue line indicates the absent lane of 1 nM BPA treatment. Full-length blots/gels are presented in Supplementary Figs. 9–10.

