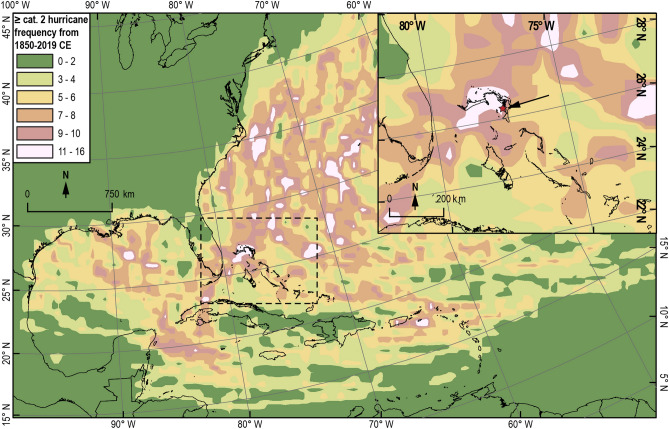
Figure 1.
Frequency of exposure to ≥ category 2 hurricane winds (Saffir-Simpson scale) within a 50 km radius from 1850 to 2019 CE throughout the North Atlantic. Storm track and intensity data is from the International Best Track Archive for Climate Stewardship (IBTrACS) v041, 2dataset. Saffir-Simpson storm intensity is specifically derived from the IBTrACS v4 subset USA_Agency_SSHS, which is derived from HURDAT_ATL maximum wind speed data. TPBH is indicated with a red star pointed out by the black arrrow in the inset panel. The regions that we refer to as modern hurricane hotspots are pinkish-white in color (11–16 ≥ category 2 events within 50 km). The Little Bahama Bank is one of these hurricane hotspots. Basemaps were downloaded from DIVA-GIS 73. Map generation and associated spatial calculations were performed in ArcMap 10.7.1 software using North America Albers Equal Conic Area projected coordinate system74. See SUPPLEMENTAL 1 for detailed methods on how the map was created.

