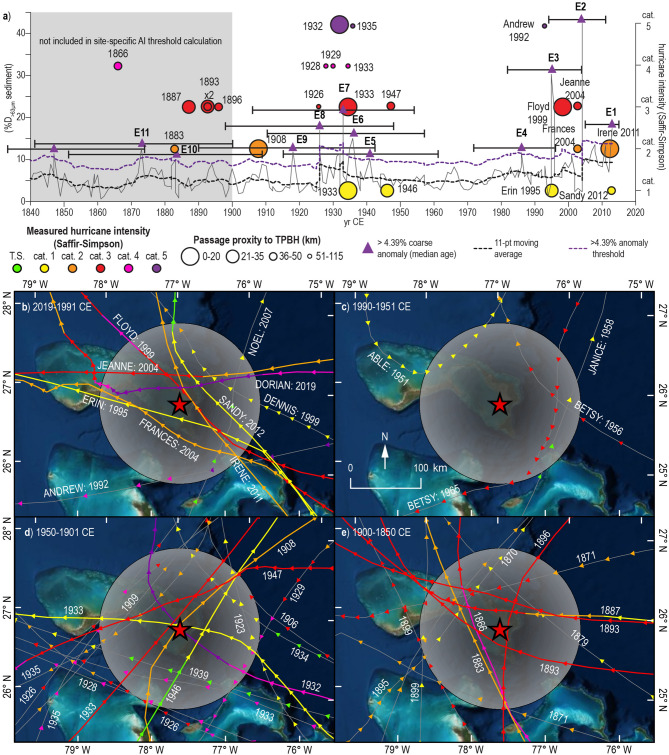
Figure 4.
Sediment record sensitivity calibration/attribution to IBTrACS observational hurricane record from 1850 to 2014 CE. a) Coarse sediment (%D>63 µm) plot (grey line) from TPBH composite record from 1850 to 2014 CE. The colored circles represent ≥ category 2 hurricanes that passed within 50 km of TPBH in the instrumental record, where larger (smaller) circles represent more proximal (distal) passage, and color represent Saffir-Simpson intensity. Coarse sediment anomalies (CSA) are peaks that exceed the 11-point moving average (dashed black line). The purple dashed line is the 4.39% D>63 µm CSA threshold, and CSAs that exceed this threshold are marked with purple triangles. (b–e) Hurricane events from the IBTrACS v41, 2 within 115 km of TPBH from 1850 to 2019 CE in intervals from (b) 2019 to 1991 CE, (c) 1990 to 1951 CE, (d) 1950 to 1901 CE, and e) 1900 to 1850 CE. Color of the storm segment denotes its Saffir-Simpson intensity category at the time of measurement based on the subset USA_Agency_SSHS, which is derived from HURDAT_ATL maximum wind speed data. The grey circle represents a 115 km radius around TPBH. Optical satellite imagery was obtained from ESRI compiled satellite imagery. Maps were made using the USA Contiguous Equidistant Conic projected coordinate system74 to accurately preserved track distanced from TPBH.

