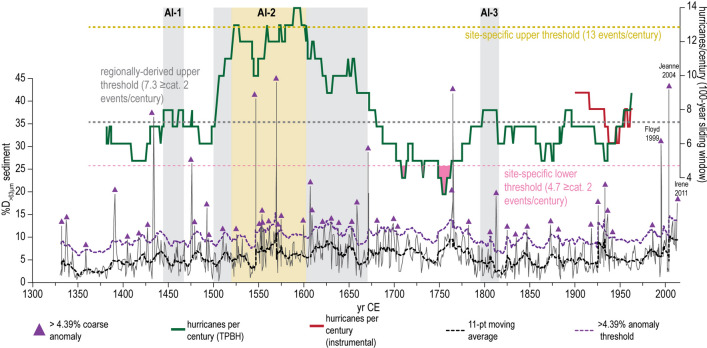
Figure 5.
Hurricane events per century recorded in Thatchpoint Blue Hole from 1330 to 2014 CE. Coarse sediment (%D>63 µm) plot (grey line) from TPBH composite record from 1330 to 2014 CE. Coarse sediment anomalies (CSA) are peaks that exceed the 11-point moving average (dashed black line). The purple dashed line is the 4.39% D>63 µm CSA threshold, and CSAs that exceed this threshold are marked with purple triangles. The red line represents 100-year sliding window counts for events based on the IBTrACS v4 observational data1, 2, and the green line represents 100-year sliding window counts for significant peaks in the composite TPBH record. Event frequency significance thresholds are depicted as: gold dashed line is the site-specific upper 90th percentile threshold of 13 ≥ category 2 events per century, grey dashed line is the regionally derived upper 90th percentile threshold of 7.3 ≥ category 2 events per century, thin light-pink dashed line is the site-specific lower 10th percentile threshold of 4.7 ≥ category 2 events per century, thin red-pink dashed line is the regionally derived lower 10th percentile threshold of 1.6 ≥ category 2 events per century. The temporal windows where events per century exceed/fall-below these upper/lower thresholds are filled in with boxes that correspond to the color of the threshold lines.

