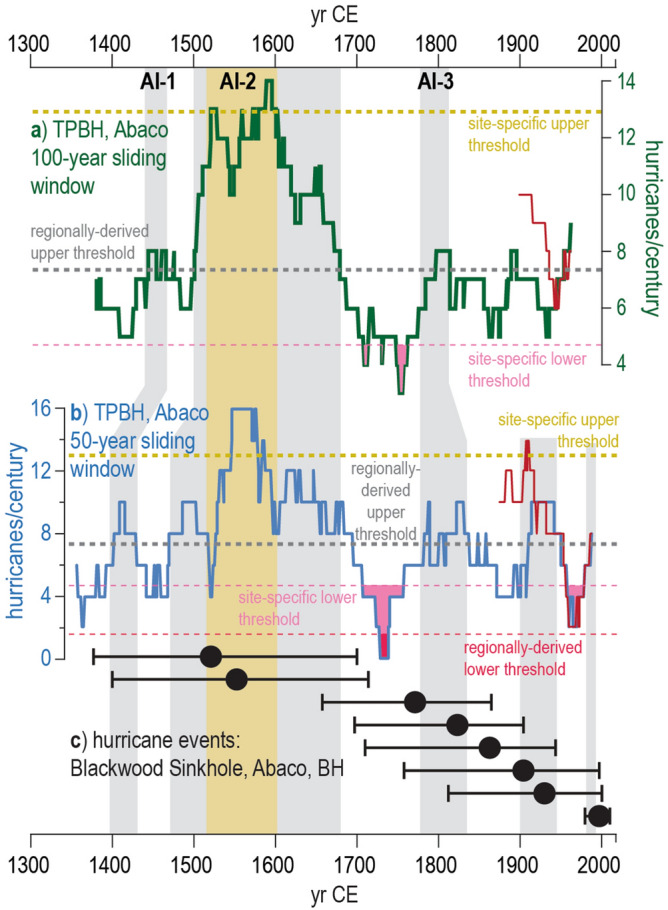
Figure 6.

Comparison of paleo-hurricane records from Abaco. (a) The solid red line represents 100-year sliding window counts for events based on IBTrACS v4 data1, 2, and the green line represents 100-year moving window counts for significant peaks in the composite TPBH record. (b) The red line represents 50-year moving window counts for events based on IBTrACS v4 data, and the blue line represents events per century calculated from 50-year sliding window counts for significant peaks in the composite TPBH record. In (a) and (b), event frequency significance thresholds are depicted as: gold dashed line is the site-specific upper 90th percentile threshold of 13 ≥ category 2 events per century, grey dashed line is the regionally derived upper 90th percentile threshold of 7.3 ≥ category 2 events per century, thin light-pink dashed line is the site-specific lower 10th percentile threshold of 4.7 ≥ category 2 events per century, thin red-pink dashed line is the regionally derived lower 10th percentile threshold of 1.6 ≥ category 2 events per century. The temporal windows where events per century exceed/fall-below these upper/lower thresholds are filled in with boxes that correspond to the color of the threshold lines. (c) Black circles represent the mean age of hurricane events recorded in Blackwood Sinkhole in northern Abaco3 and the associated 2σ-age uncertainty is marked by the black lines extending from each circle.
