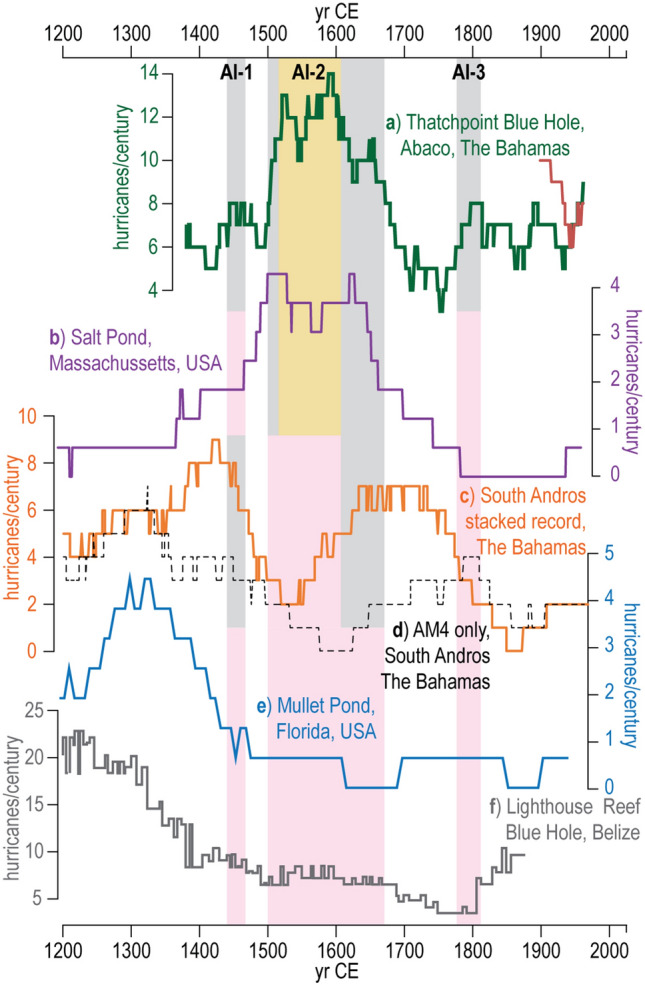
Figure 7.

Comparison of high-resolution paleo-hurricane records from throughout the North Atlantic. Hurricane events per century based on sedimentary reconstructions of regional hurricane frequency per century over the last 800 years at sites throughout the North Atlantic including: (a) TPBH 100-year sliding window counts (green line), (b) Salt Pond in Massachusetts18 (purple line), (c) South Andros, The Bahamas stacked record presented in this study but derived from Wallace, et al.25 (orange line) and (d) AM4 (single record) in South Andros25, (orange line). (e) Mullet Pond on the Florida Gulf of Mexico Coast27 (blue line); (f) Lighthouse Blue Hole, Belize23 (grey line). The gold and grey boxes correspond to TPBH Composite record 100-year count statistical active intervals as defined in Fig. 5. The pink boxes match the temporal extent of these active intervals, but indicate lack of correlation between the timing/magnitude in the other records.
