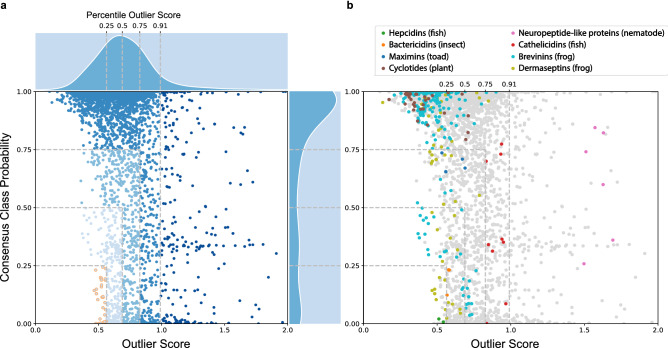
Figure 5.
(a) Scatterplot showing the distribution of 3081 AMPs according to outlier scores and hemolytic (HemoPI-1) consensus class probabilities. Changes in the outlier scores and probabilities are illustrated with different shades of blues. Selected 34 non-hemolytic AMPs (golden circles) with lowest outlier scores and hemolytic predictions. Darkest data points are 273 AMPs detected as outliers according to HemoPI-1 Average KNN with percentile outlier scores > 0.91. (b) Colour-coded antimicrobial peptide families (e.g. dermaseptins) from different source organisms.

