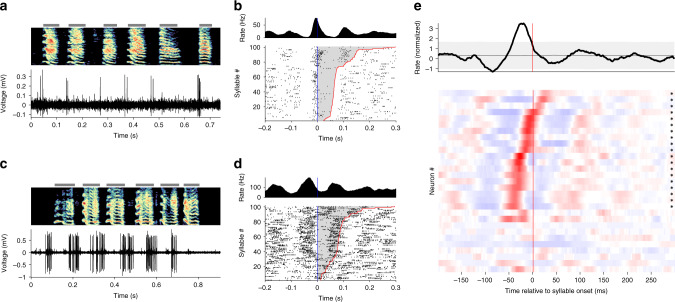
Fig. 2. Onset-related activity in NIf during singing in juvenile birds.
a–d Examples of NIfHVC single-neuron activity during singing in juvenile birds. a Song spectrogram (top), and single-unit recording (bottom). Gray bars indicate the extent of each syllable. Here and elsewhere, the vertical axis of the spectrogram represents frequencies ranging from 0.5 to 8 kHz. Note the neuron tends to burst at syllable onsets. b Onset-aligned raster and PSTH for neuron at left, sorted by syllable duration. Syllable onset is marked in blue, offset in red, with the duration of each syllable shaded gray. c, d Same as a and b for another putative NIfHVC recorded neuron during singing. Note that this neuron has a longer premotor latency, longer burst durations, and higher firing rates. e Summary of all NIfHVC single-unit recordings during singing. The plot at top shows the mean normalized firing rate across all neurons, with gray region showing the extremes of a circularly shifted control (p < 0.01, two-sided comparison). Plotted below is the syllable onset-aligned PSTH for each individual NIfHVC neuron; each row corresponds to the PSTH of a different neuron. PSTHs are normalized by subtracting the mean and dividing by the standard deviation of the PSTH; red indicates values above the mean, blue below the mean. Neurons with a significant PSTH peak are marked by an asterisk at right (p < 0.05, one-sided comparison to circularly shifted control, Bonferroni corrected for 29 comparisons). Significant neurons are sorted by the latency of their peak firing rate, and non-significant neurons are shown at bottom.

