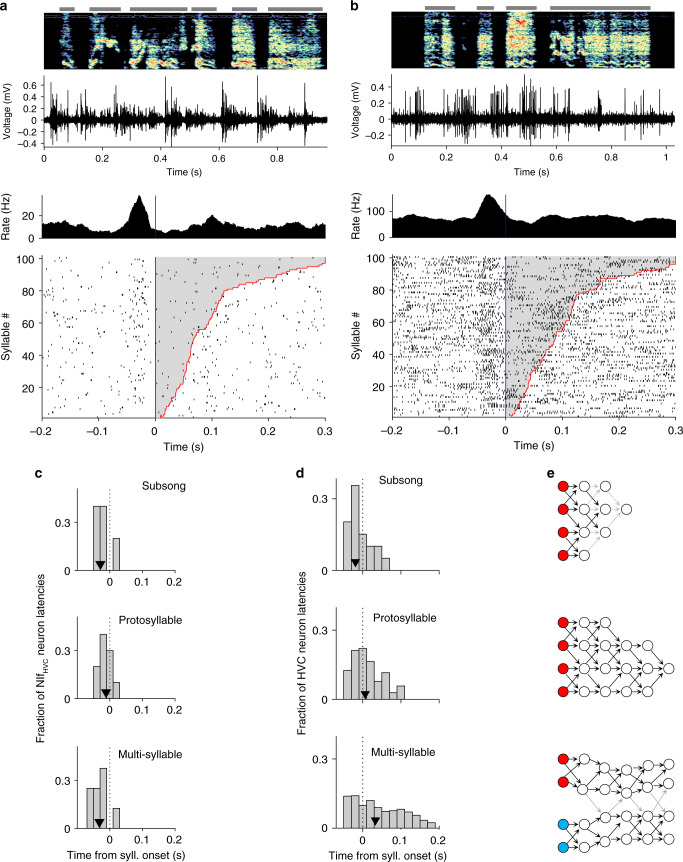
Fig. 3. Distributions of response latencies relative to syllable onset at different stages of vocal development.
a An example putative NIfHVC neuron recorded during subsong (49 dph), the earliest stage of vocal development. b Another example of a NIf neuron recorded during subsong (47 dph). Note the premotor latencies relative to syllable onset. c Histogram of latency relative to syllable onset for song-locked putative NIfHVC neurons at subsong (50 dph or younger), protosyllable (51–59 dph), and multi-syllable (60 dph or older) stages. Latency is defined as time of the peak in the syllable-onset-aligned PSTH. Triangles indicate median. d For comparison, histogram of latency relative to syllable onset for HVC projection neurons across development, reproduced from ref. 40. Here, song stages are defined based on syllable duration distributions, with median and interquartile range 48 ± 4 dph for subsong; 58 ± 10 dph for protosyllable song and 62 ± 12 dph for multi-syllable stage (n = 19, 104, and 814 neurons, respectively). e Schematic of possible HVC network connectivity at each stage of development40, consistent with latencies observed in HVC and NIf. Neurons receiving external input are marked by filled circles, with different colors representing syllable-specific inputs. Connections between neurons are marked by arrows, where darker arrows represent stronger connections.

