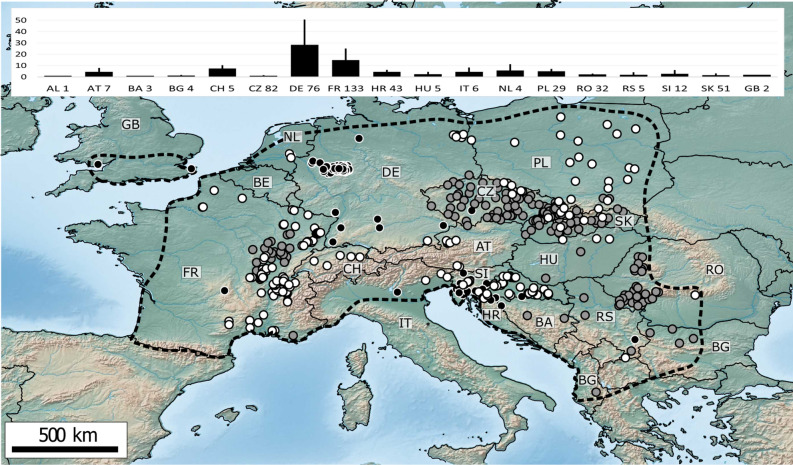
Figure 1.
Map of Gammarus fossarum sampling sites. Dots indicate sampling sites (498); white with black contour represent new original data (206 sites), grey with black contour indicate sites associated with authors' previous publications (198 sites), black with white contour indicate sites for data derived from other published papers (94 sites). To prevent overlap of very closely located sites, some positions are slightly shifted. Thin blue-grey lines correspond to first-order river, and black lines are country borders. Dashed grey line represents the simplified distribution range limits for G. fossarum, adapted from Piscart and Bollache96. Countries (19) are indicated by their corresponding two-letter ISO codes: AL, Albania; AT, Austria; BA, Bosnia and Herzegovina; BE, Belgium; BG, Bulgaria; CH, Switzerland; CZ, Czechia; DE, Germany; FR, France; HR, Croatia; HU, Hungary; IT, Italy; NL, Netherlands; PL, Poland; RO, Romania; RS, Serbia; SI, Slovenia; SK, Slovakia; UK, United Kingdom. Top Inset represent sampling effort for each country: mean number of samples per site + S.E.. Number by the ISO code is the number of sites sampled. Map created with QGIS 3.4.5 (https://www.qgis.org/fr/site/).

