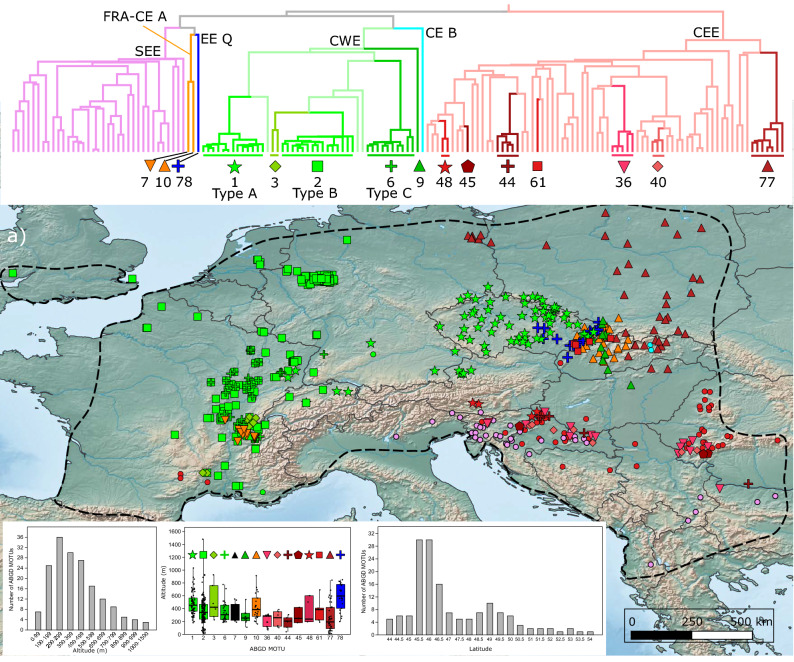
Figure 4.
Geographical and altitudinal distribution of major clades and AGBD-MOTUs in reference to their phylogenetic position. (a) Thin blue lines on map present first-order river, bold grey lines are country borders. Dashed black line represents a simplified distribution range limits for G. fossarum. (b) Simplified version of the Chronogram from Fig. 2. The six major clades distinguished in Fig. 2 are highlighted by the same colour code, both on the map and on top inset tree: SEE (South-Eastern Europe, purple), FRA CE A (France Central-Europe A, yellow), EE Q (Eastern-Europe Q, dark blue), CWE (Central-Western Europe, green), CE B (Central-Europe-B, turquoise blue) and CEE (Central-Eastern Europe, red). The 84 ABGD-MOTUs were split into two categories: MOTUs with narrow distribution based on our sampling (< 100 km between the most distant sites) and more broadly distributed MOTUs. The colour code for major clades was followed. Presence of the narrowly distributed MOTUs is indicated with a circle on the map, while the more broadly distributed MOTUs were attributed a specific symbol (see the top inset tree for details). To prevent overlap of symbols in sites with co-occurrence, some positions are slightly shifted. (c) The histogram presents the absolute frequency of ABGD-MOTUs according to altitude. (d) The altitudinal distribution of broadly distributed ABGD-MOTUs based on ABGD method is presented as box plot. The colour code follows major clade designation of the top inset tree (see Fig. 2 for details). The dots represent sampling sites, thick black bar represent the mean, grey box represents first and last quartile, thin vertical line represents min–max values. (e) Histogram representing the number of lineages per latitudinal band. Maps created with QGIS 3.4.5 (https://www.qgis.org/fr/site/) and trees with BEAST 2.4.8 (https://www.beast2.org/).

