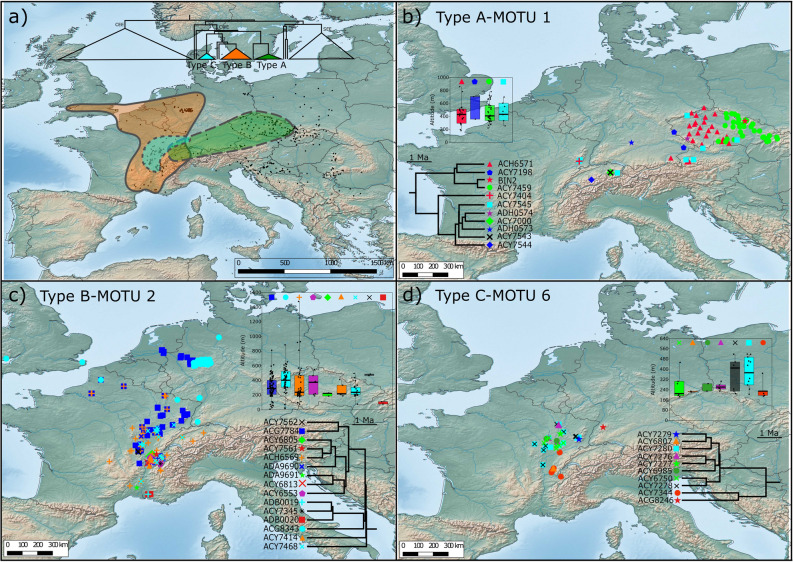
Figure 5.
Geographical and altitudinal distribution of the three AGBD-MOTUs 1, 2 and 6, corresponding to types A, B and C as defined by Müller et al. (2000), respectively, and the contained BIN-MOTUs. (a) General distributional range of the three ABGD-MOTUs, 1, 2 and 6 , corresponding to type A, B and C as defined by Müller et al.54 (2000), respectively. Thin dashed line indicates the distribution of each ABGD-MOTU. The tree presented is a collapsed version of the chronogram highlighting the phylogenetic position of key MOTUs. (b–d) Distributional maps of BIN-MOTUs within each the three ABGD-MOTUs 1, 2 and 6, respectively. To prevent overlap of symbols in sites with co-occurrence, some positions are slightly shifted. Each presents both, the phylogenetic relationship between BIN-MOTUs and the symbols used in the map and in the box plot. Box plots show the altitudinal distribution of each BIN-MOTU. Dots represent sampling sites, thick black bar represent the mean, grey box represents first and last quartile, thin vertical line represents min–max values. Maps created with QGIS 3.4.5 (https://www.qgis.org/fr/site/) and Trees with BEAST 2.4.8 (https://www.beast2.org/).

