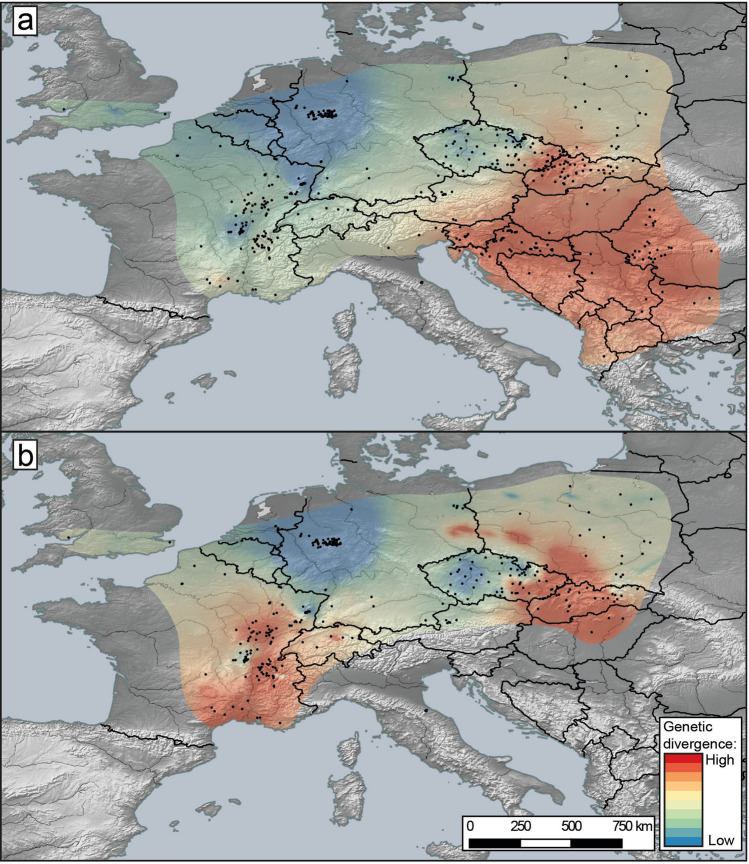
Figure 6.
A genetic landscape map based on COI mtDNA haplotypes overlaid onto a relief map of Europe. Black dots indicate sampling sites. Warmer colour (red) reflects high molecular divergence between neighbouring localities, while colder colour (blue) corresponds to areas of lower molecular divergence. (a) Map including all the sampling sites (498) and all haplotypes (691). (b) Map excluding highly divergent lineages endemic to the Carpathian, Dinaric and Pannonian regions (hotspots of most ancient divergence), to better illustrate the level of genetic divergence in the remaining area (469 haplotypes and 336 sites). Genetic distances were generated with Alleles in Space (AIS; https://www.marksgeneticsoftware.net) and maps created with QGIS 3.4.5 (https://www.qgis.org/fr/site/).

