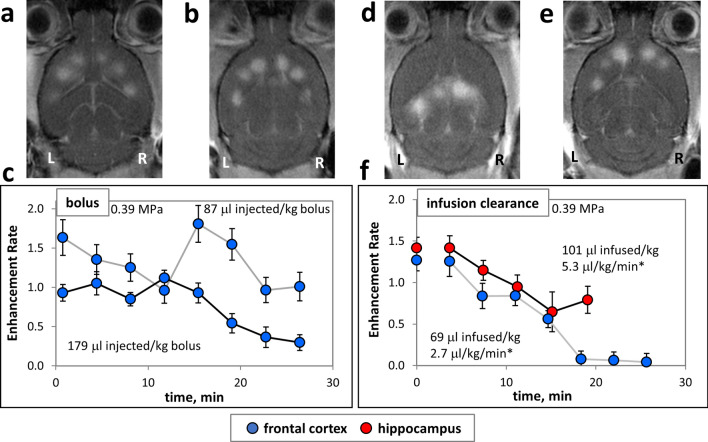
Figure 5.
Enhancement rate dynamics with FUS treatment during microbubble systemic clearance. (a–c) Systemic bolus injections of microbubble solutions with FUS treatment commencing immediately after injection. Representative MR images of FUS treated brains at points in the frontal cortex post (a) 3.3 µl/kg/min bolus and (b) 6.8 μl/kg/min bolus injections. (c) Plots of enhancement rate versus time post start of FUS treatment corresponding to images in (a,b). (d–f) Infusion clearance experiments where microbubbles were infused briefly and FUS treatment began immediately after infusion was stopped. Representative MR images of FUS treated brains at points in (d) hippocampus and (e) frontal cortex. (f) Plots of enhancement rate versus time after the start of FUS treatment corresponding to images in (d,e). *Average microbubble dosage rates are calculated as total volume of microbubble agent delivered over total treatment time. Points treated in frontal cortex are shown in blue, and rostral hippocampus in red. For each animal (represented by each trace in the plots) the total quantity of microbubbles delivered (in μl of equivalent undiluted agent) per kg is given. Dividing by total duration of FUS treatment yields a nominal bubble agent dose delivery per treatment time, permitting comparison to other experiments in this study. WL and WW of images have been adjusted as stated in “Methods” section.

