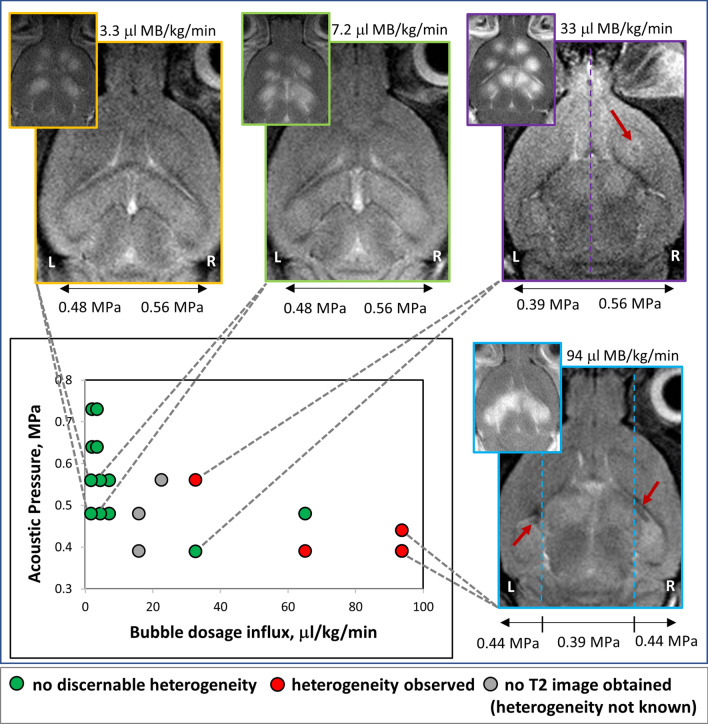
Figure 6.
Representative images showing heterogeneity in brain parenchyma as indicated by T2-weighted MR images. T2-weighted images with corresponding inset of post-contrast T1-weighted images showing differences in T2 heterogeneity at some FUS treated locations. Case examples shown in images correspond to specific points on the plot of acoustic pressure versus bubble dosage influx (lower left, connected to images by dotted lines) where T2 heterogeneity was observed. WL and WW of images have been adjusted as stated in “Methods” section.

