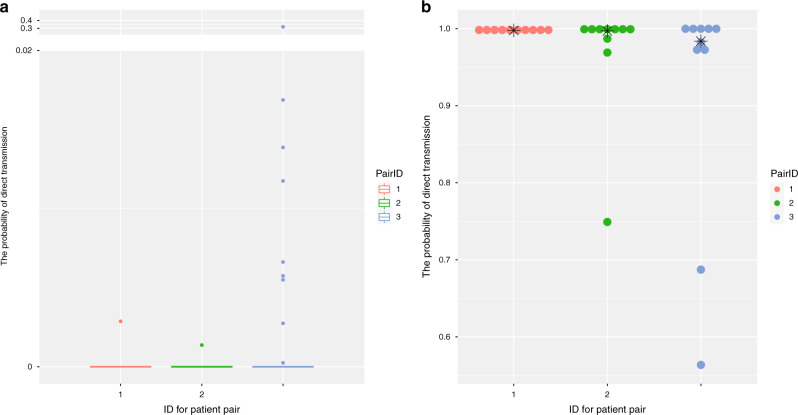
Fig. 2. Validation of direct transmission events with high quality.
a Boxplot of the bidirectional probability for direct transmission between three patients (ID:1, 2, and 3 represent EPI_ISL_408486, EPI_ISL_421236, and EPI_ISL_412898, respectively) and others (do not include the person who directly transmit to each other). Upper bound, center, and lower bound of box represent the 75th percentile, the 50th percentile (median), and the 25th percentile, respectively. Whiskers represent 1.5× interquartile range and points are outliers. b Dotplot of the bidirectional probability for direct transmission of three paired patients with high quality (ID:1, 2, and 3 represent EPI_ISL_408486 vs. EPI_ISL_421252, EPI_ISL_421236 vs. EPI_ISL_421235, and EPI_ISL_412898 vs. EPI_ISL_402127, respectively) using different phylogeny. The dot represents the result from randomly selected tree. The star represents the result from MCC tree.

