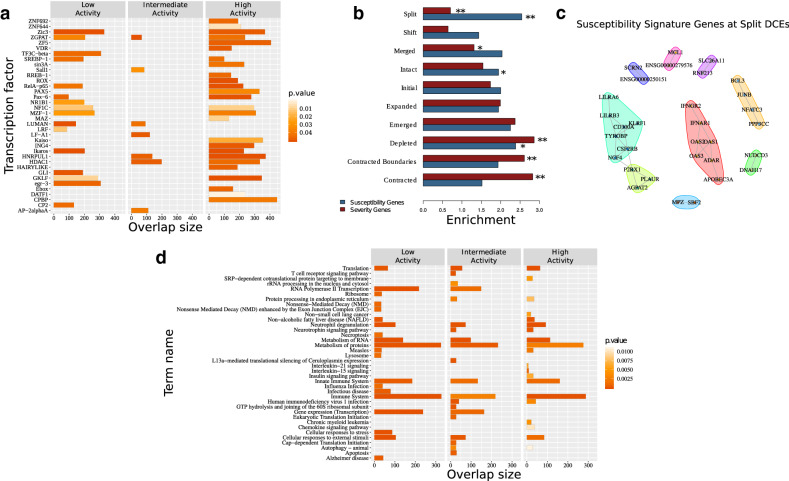
Figure 3.
Functional analysis of the disruption events. (a) Enrichment analysis of ‘Disruptors’ in genes that are commonly regulated (suggested by the mutual regulatory motif matches—TRANSFAC database) by transcription factors indicated on y axis. The overlap between the query gene set and the corresponding Pathway members or TF-target genes are displayed on the x axis. The color of each bar illustrates the corrected p value of the corresponding enrichment test. (b) Average positional enrichments of susceptibility and severity genes6 against different types of DCEs. Significance levels of one hundred permutations (*:0.05; **:0.01). (c) Protein interaction networks for susceptibility signature genes that are found to be differentially expressed and overlapping split DCE boundaries, as obtained from STRING-DB35. Genes are grouped on the basis of a modularity analysis. Modules are shown with coloured polygons around genes (red: interferon signature genes, cyan: DAP12 signaling, lime: neutrophil module, green: B-cell module). (d) Pathway enrichment analysis of genes which correspond to enhancer-TSS links (CD4+ cells—Enhancer Atlas)37, that are nested in healthy group DCEs but disrupted in SLE. The top 20 most significant KEGG or/and REACTOME pathways are presented.

