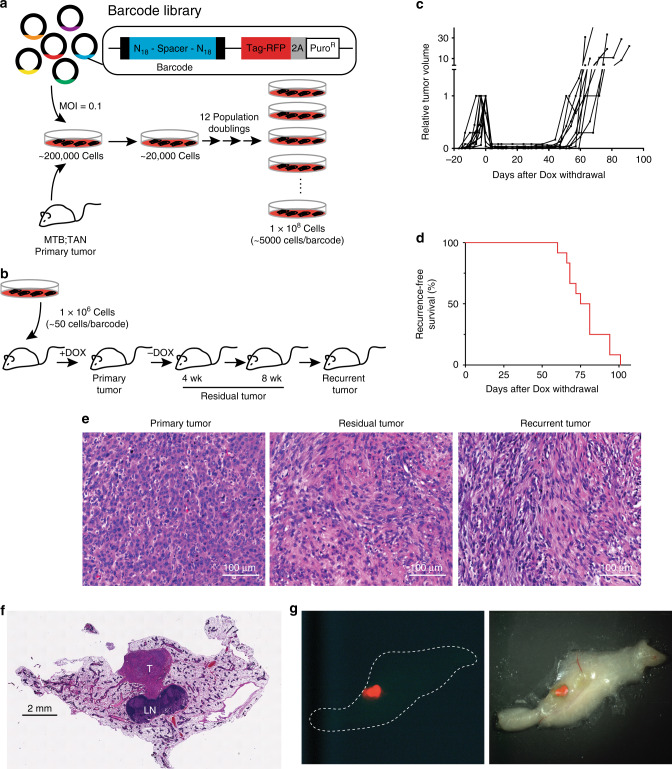
Fig. 1. Cellular barcoding to track clonal dynamics during tumor regression, residual disease, and recurrence.
a Schematic of cellular barcoding strategy. Primary Her2-driven mouse mammary tumors were digested, cultured with Dox, and 200,000 cells were infected at low MOI (0.1) with a lentiviral barcode library comprising ~60 million unique barcodes. Following selection for transduced cells, the population was expanded to yield a population of 100 million cells comprising ~20,000 unique barcodes (~5000 cells/barcode). b One million barcoded tumor cells were injected bilaterally into the inguinal mammary glands of nu/nu mice on Dox. Once orthotopic primary tumors reached 5 mm in diameter, one cohort of mice was sacrificed with primary tumors (n = 6 tumors). Dox was removed from the remaining mice, and cohorts were sacrificed with residual tumors after 4 weeks (n = 6 tumors) and 8 weeks (n = 6 tumors). A final cohort of mice was monitored until recurrent tumors formed (n = 12 tumors). c Tumor growth curves showing primary tumor growth, regression, residual disease, and recurrence for representative orthotopic Her2-driven tumors. d Kaplan–Meier recurrence-free survival curves for barcoded orthotopic tumors. e H&E-stained sections of a representative primary, residual, and recurrent tumor. Scale bar = 100 μm. Images are representative of four independent tumors. f H&E-stained section of a mammary gland whole-mount showing the size and location of a representative residual tumor. T tumor, LN lymph node. Scale bar = 2 mm. Image is representative of three independent tumors. g Fluorescent (left) and merged fluorescent-brightfield (right) image of a representative fluorescently labeled residual tumor (red) within the mammary gland.

