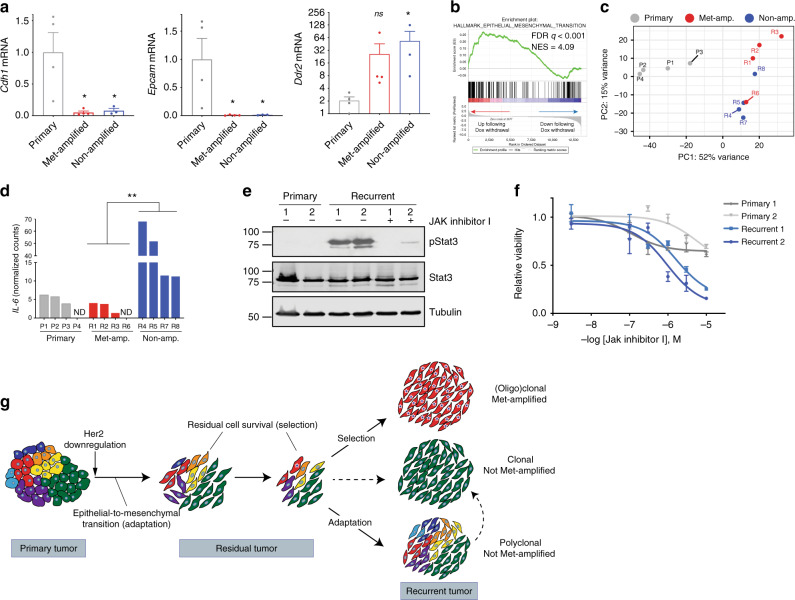
Fig. 5. Polyclonal recurrent tumors have distinct gene expression profiles.
a qRT-PCR analysis showing expression of epithelial (Cdh1 and Epcam) and mesenchymal (Ddr2) markers in primary tumors, Met-amplified recurrent tumors, and non-amplified recurrent tumors. Significance was determined using one-way ANOVA with Dunnett’s multiple comparison testing. *P < 0.05 between each recurrent cohort and the primary tumor cohort. Cdh1: primary vs met-amplified, P = 0.015; primary vs. non-amplified, P = 0.025. Epcam: primary vs met-amplified, P = 0.027; primary vs. non-amplified, P = 0.039. Ddr2: primary vs met-amplified, P = 0.11; primary vs. non-amplified, P = 0.01. n = 4 biologically independent primary tumors, n = 4 biologically independent Met-amplified recurrent tumors, and n = 3 biologically independent non-Met-amplified recurrent tumors in each cohort. Data are presented as mean ± SEM. b Gene set enrichment analysis showing enrichment of an EMT signature in cells following Her2 downregulation in vitro. Normalized enrichment score was calculated using the Kolmogorov–Smirnov statistic. To correct for multiple testing, the FDR q-value was estimated using permutation testing to compare the actual NES to random gene sets. c Principal components analysis (PCA) of gene expression profiles in primary tumors, and recurrent tumors with and without Met amplification. d Normalized counts of IL-6 expression from RNA-seq analysis of primary tumors, Met-amplified recurrent tumors, and non-amplified recurrent tumors. Significance was determined using one-way ANOVA with Tukey’s multiple comparison testing. ANOVA P = 0.039. *P < 0.05 between Met-amplified recurrent tumors and non-amplified recurrent tumors (Met-amplified vs. Non-amplified, P = 0.048). n = 4 biologically independent primary tumors, n = 4 biologically independent Met-amplified recurrent tumors, and n = 4 biologically independent non-Met-amplified recurrent tumors in each cohort. e Western blot showing Stat3 phosphorylation (Y705) in primary and recurrent tumor cells derived from the autochthonous model. Note that the primary cells are donor tumor #1 and 2, and both recurrent tumor cells do not have Met amplification. Molecular weight markers (kDa) are shown at the left. Results are representative of three independent experiments. f Dose-response curves of primary and recurrent tumor cells treated with increasing concentrations of Jak inhibitor I. n = 2 biologically independent primary tumor cell lines and n = 2 biologically independent recurrent tumor cell lines examined over three independent experiments. Data are presented as mean ± SEM. g Model showing adaptation and selection shaping the clonal composition of tumors during residual disease and recurrence.

