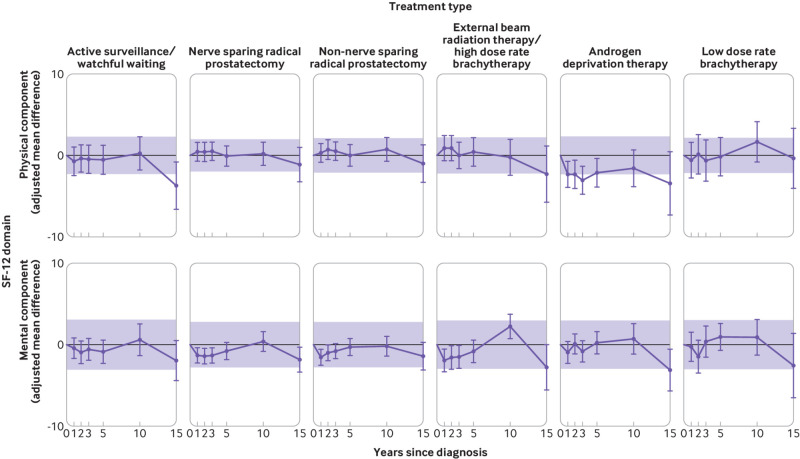
Fig 3.
Adjusted mean differences between initial treatment group (purple line) and control group (bold black line) follow‐up 12-item Short Form Health Survey (SF-12) scores. Controls are the reference group (adjusted mean difference=0). Shaded region indicates adjusted mean differences within minimally important difference. Minimally important difference limits are calculated as plus or minus one third of the pooled baseline standard deviation of the control group and of the treatment group. Adjusted mean differences are adjusted for the following baseline characteristics: age, marital status, having private health insurance, region of residence, income, education, country of birth, comorbidity score, and domain‐specific baseline (year 0) 12-item Short Form Health Survey score

