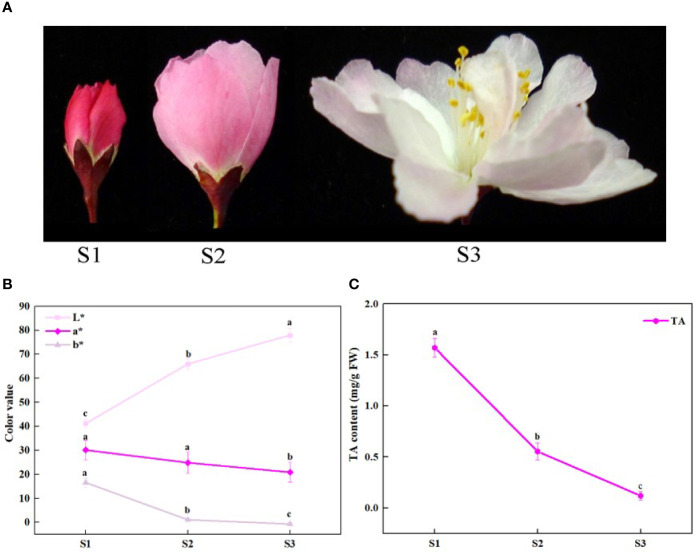
Figure 1.
Schematic of phenotypic and total anthocyanin content at different developmental stages of Malus halliana. (A) The flower color change at three stages. (B) L*a*b* values of petals at three stages. (C) The total anthocyanin (TA) content at three stages. S1, small bud stage; S2, initial-flowering stage; S3, late-flowering stage. Error bars indicate standard deviation (SD) obtained from four biological replicates. Different letters between cultivars denote significant differences (Duncan test, p < 0.05).

