Figure 2.
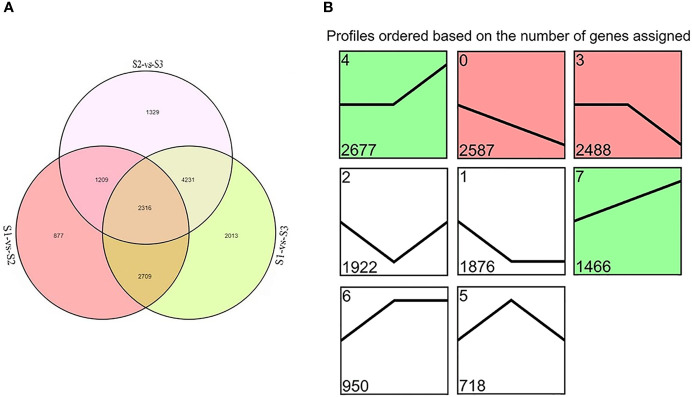
The differentially expressed genes (DEGs) screened by RNA-Seq analysis during flower developmental stages of Malus halliana. (A) Venn diagram of DEGs in three comparisons (S1-vs-S2, S1-vs-S3, and S2-vs-S3, respectively). (B) Trend analysis of DEG expression during flower developmental stage (from S1 to S3). Colored block trend: significant enrichment trend (Q ≤ 0.05). Green color indicated upregulation trend and red color indicated downregulation trend. Without color trend: the enrichment of trends.

