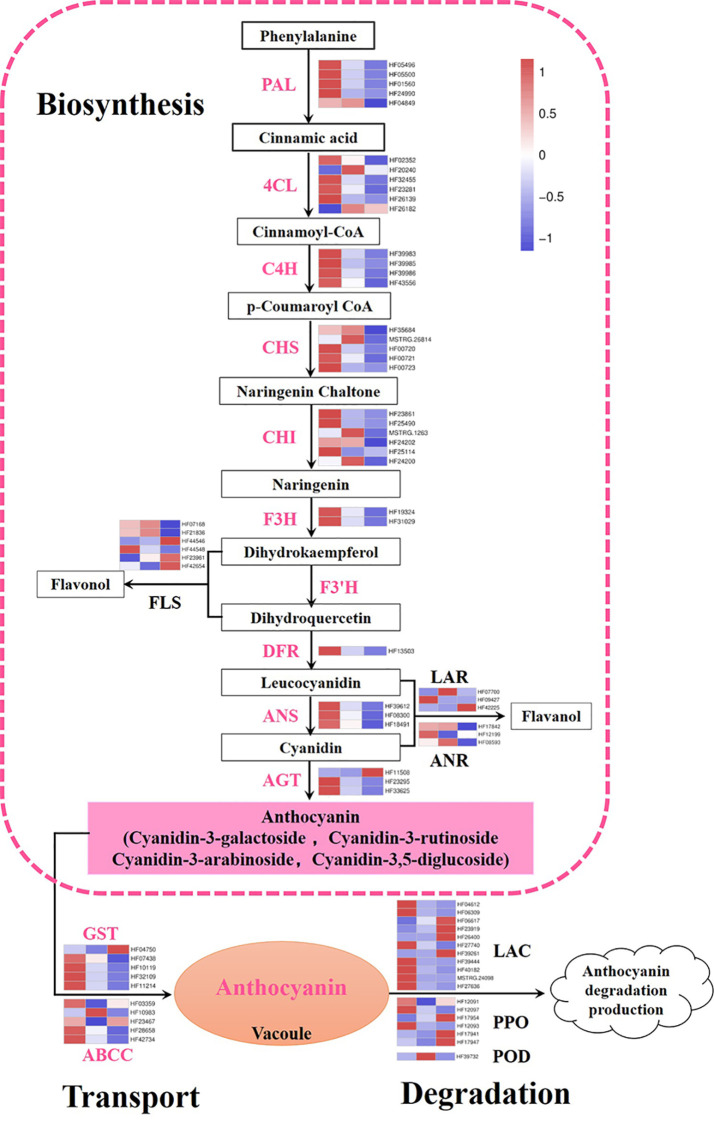
Figure 3.
Expression pattern of genes involved in anthocyanin biosynthetic, degradation, and transport pathway. Color boxes from left to right represent genes expression level at S1, S2 and S3. PAL, phenylalanine ammonia lyase; 4CL, 4-coumarate coenzyme A ligase; C4H, cinnamate 4-hydroxylase; CHS, chalcone synthase; CHI, chalcone isomerase; F3H, flavanone 3-hydroxylase; F3’H: flavonoid 3’-monooxygenase; DFR, dihydroflavonol-4-reductase; ANS, anthocyanidin synthase; AGT, anthocyanidin 3-O-glucosyltransferase; FLS, flavonol synthase; LAR, leucoanthocyanidin reductase; ANR, anthocyanidin reductase; GST, glutathione S-transferase; ABCC, ATP-binding cassette; LAC, laccase; PPO, polyphenol oxidases; POD, class III peroxidases. Color saturation represents the normalize expression level of genes at S2 and S3 with S1 based on fold change, the color gradient on the right, ranging from blue to white to red represents low, middle, and high values of gene expression.

