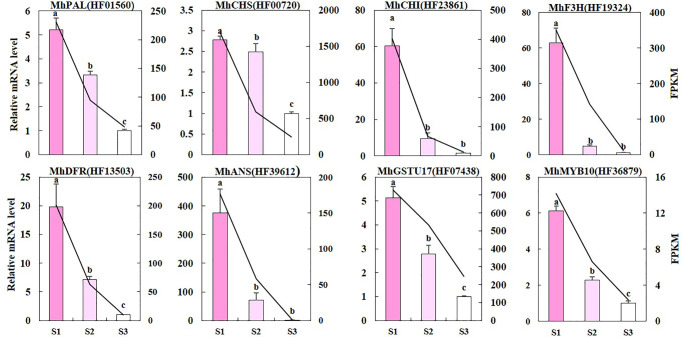
Figure 5.
The qRT-PCR validation of DEGs. The left y-axis denotes the RNA relative expression obtained by qRT-PCR. Error bars indicate the standard errors. Different letters between cultivars denote significant differences (Duncan test, p < 0.05). The right y-axis represents the fragments per kilobase per million fragments (FPKM) value of each gene using RNA sequencing analysis.

