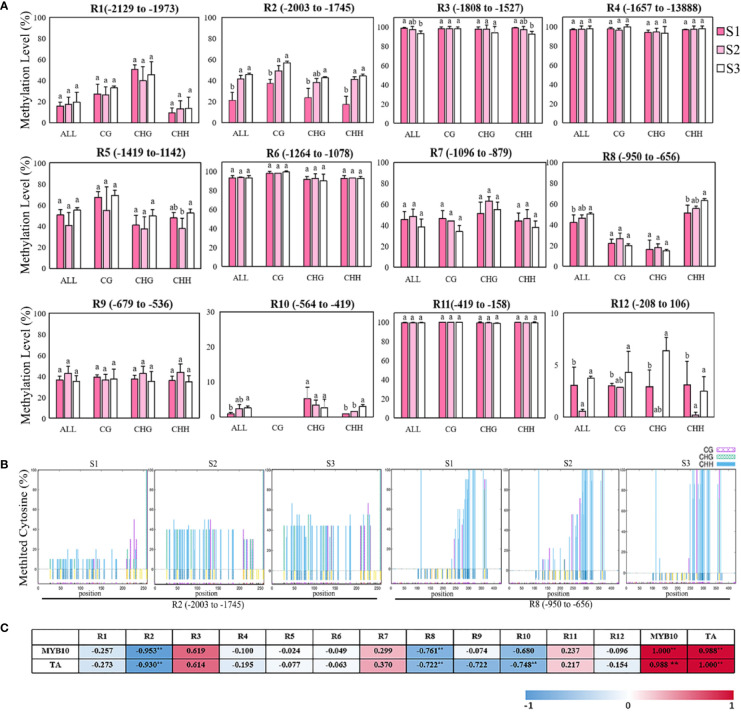
Figure 7.
Bisulfite sequencing analysis of cytosine methylation levels of different regions in MhMYB10 promoter at the different flower stages. (A) The methylation levels of MhMYB10 promoter at the different stages. Each data point represents a mean ± SD of three independent DNA extractions with three independent technical replicates. Ten independent clones from each reaction were sequenced and analyzed. In the x axis, “All” refers to overall methylated cytosines, while CG, CHG and CHH refer to the three different contexts of cytosines, in which H represents nucleotide A, C, or T. Different letters between cultivars denote significant differences (Duncan test, p < 0.05). (B) The methylation levels of different cytosine contexts (CG, CHG, CHH, H represents nucleotide A, C, or T) in R2 and R8 regions at the different stages. (C) The correlation analysis between the methylation level of MhMYB10 and MhMYB10 expression and anthocyanin content.

