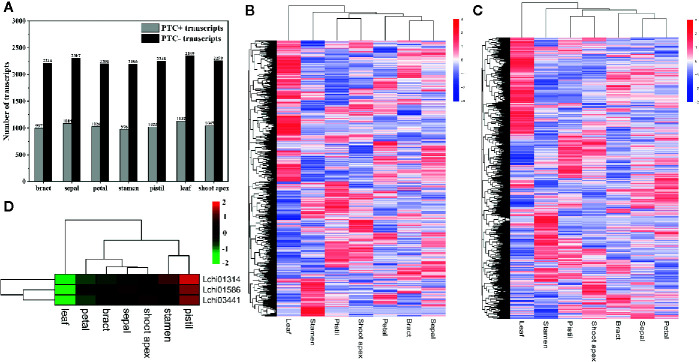
Figure 4.
Statistics and hierarchical cluster analysis of PTC+ transcripts, PTC- transcripts, and Upf genes. The log10(FPKM + 1) values of transcripts were used for the hierarchical cluster analysis (A) Statistics of PTC+ transcripts and PTC- transcripts in different tissues. (B, C) Hierarchical cluster analysis of PTC+ transcripts and PTC- transcripts, respectively. (D) Hierarchical cluster analysis of five Upf genes in L. chinense.

