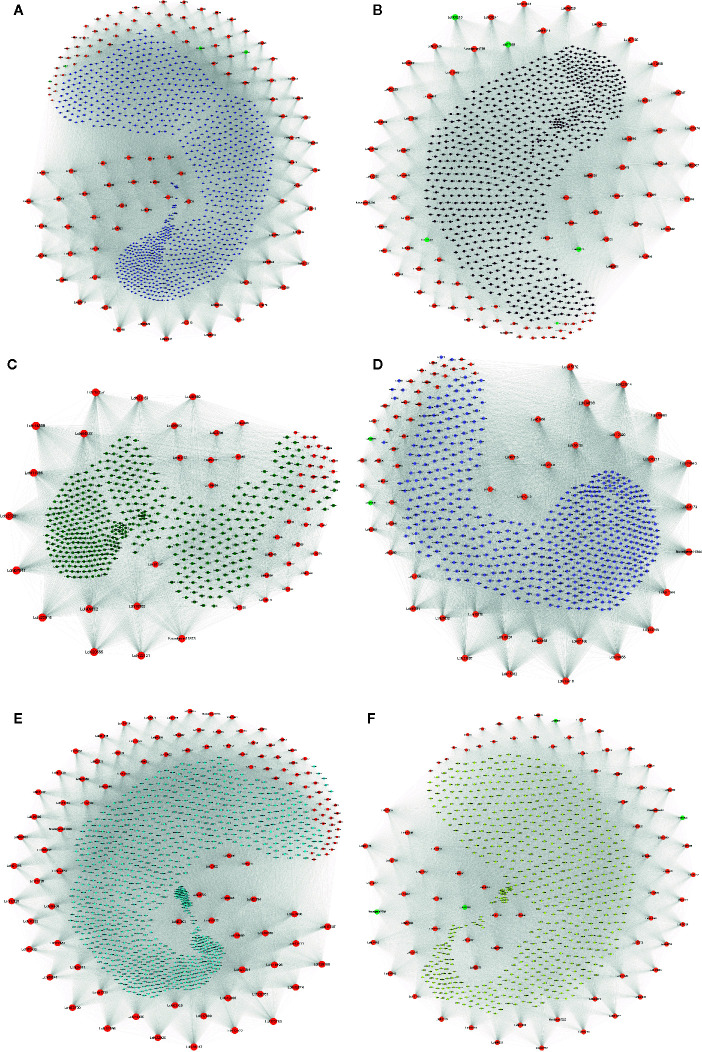
Figure 7.
Network of hub alternative splicing (AS) genes and their related genes in six coexpression modules. Hub genes are represented by orange-red notes, medium-aquamarine notes represent TFs that were also identified as hub genes, and other colored notes represent genes that were related to hub genes. The size of the note represents the degree of interaction between the hub gene and other genes, and larger notes indicate that the hub gene interacts with more genes. (A–F) Network of hub AS genes and their related genes in the blue, brown, green, gray, turquoise, and yellow modules, respectively.

