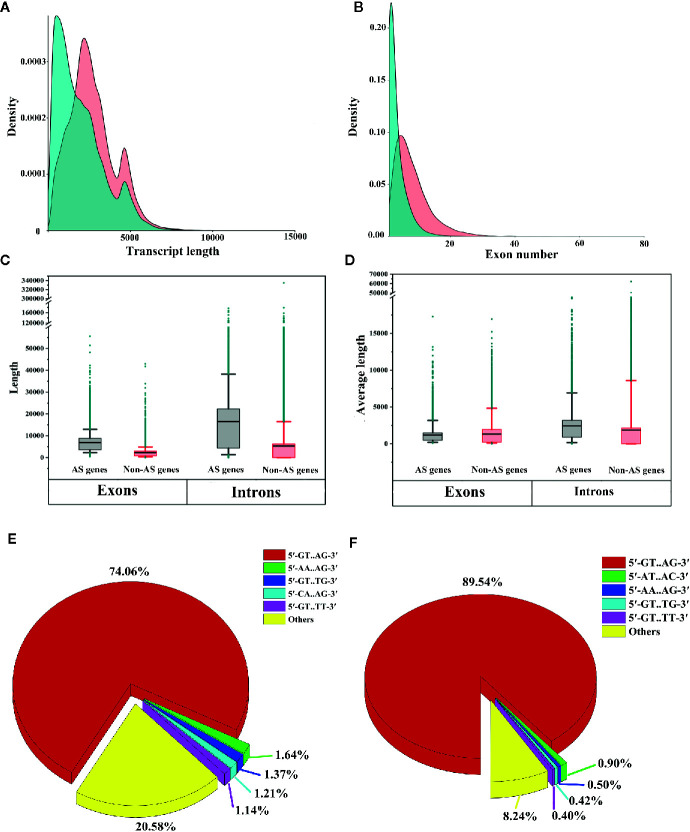
Figure 8.
Comparative analysis of alternative splicing (AS) genes and non-AS genes. (A) Comparison of transcript lengths between AS genes and non-AS genes. (B) Comparison of the numbers of exons of AS genes and non-AS genes. (C) Box plot of exon lengths and intron lengths of AS genes and non-AS genes. (D) Box plot of the average lengths of exons and introns of AS genes and non-AS genes. Boxes represent 25th and 75th percentiles. Whiskers represent 5th and 95th percentiles, and black lines in the boxes represent the median values. Dark cyan circles represent outliers. (E) Proportion of splicing sites in AS genes (only shown top 5 types). (F) Proportion of splicing sites in non-AS genes (only the top 5 types are shown).

