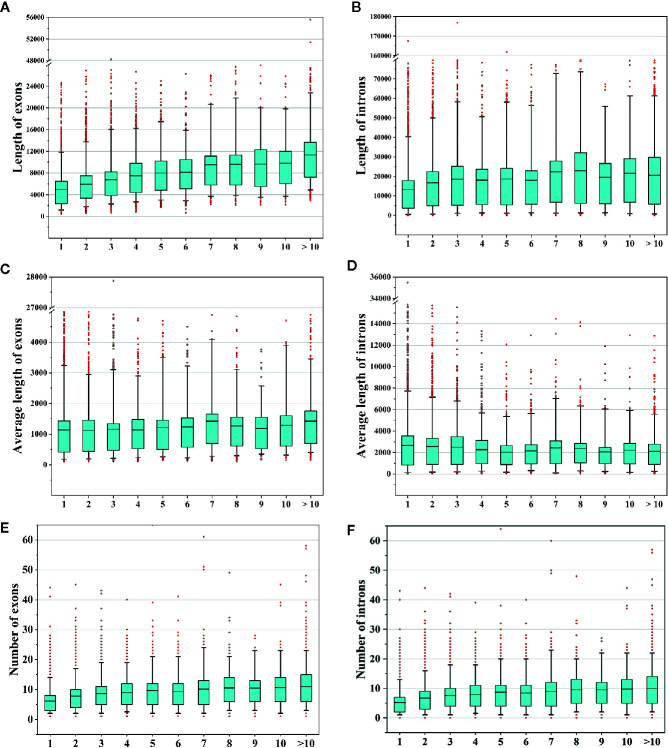
Figure 9.
Analysis of alternative splicing (AS) events and gene features. (A, B) Comparison of the total lengths of exons/introns of AS genes that underwent different numbers of AS events. (C, D) Comparison of the average lengths of exons/introns of AS genes that underwent different numbers of AS events. (E, F) Comparison of the numbers of exons/introns of AS genes that underwent different numbers of AS events.

