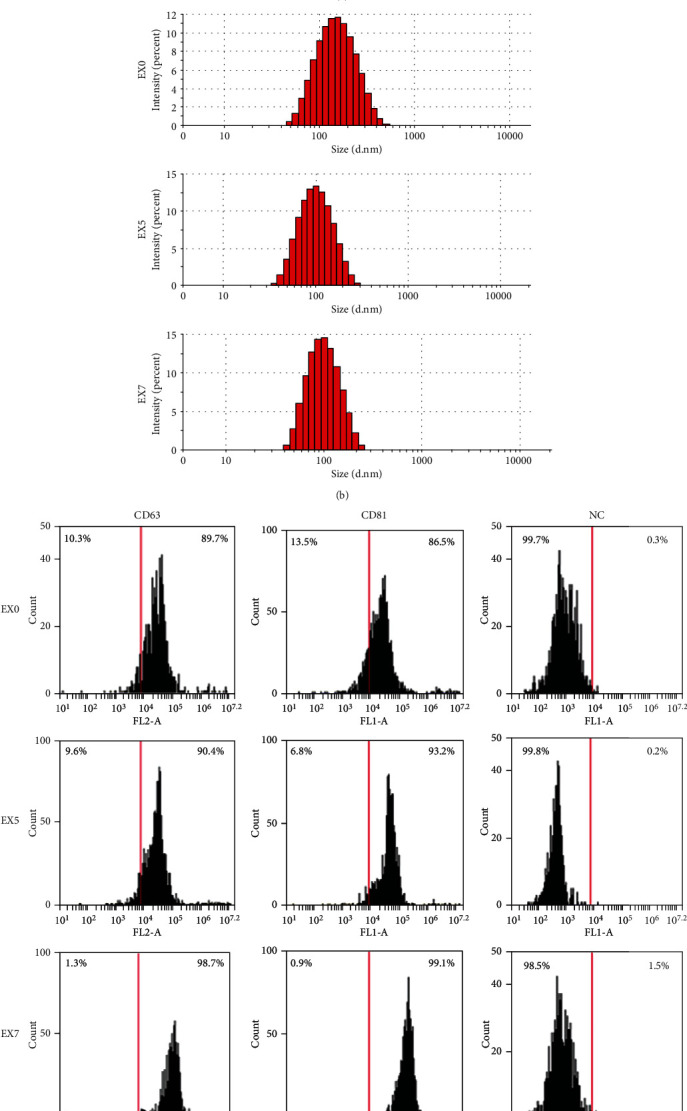
Figure 2.

Identification of exosomes by (a) transmission electron microscopy, (b) nanoparticle tracking analysis, and (c) flow cytometry assay. (a) Electron micrographs showed that all exosomes detected were circular structures with a size range of 20-120 nm. (b) The average particle size and main peak of particle size were within the range of exosome particle size. (c) The exosome-specific marker (CD63 and CD81) in EX0, EX5, and EX7 was detected by flow cytometry. The NC group was exosomes with no stain.
