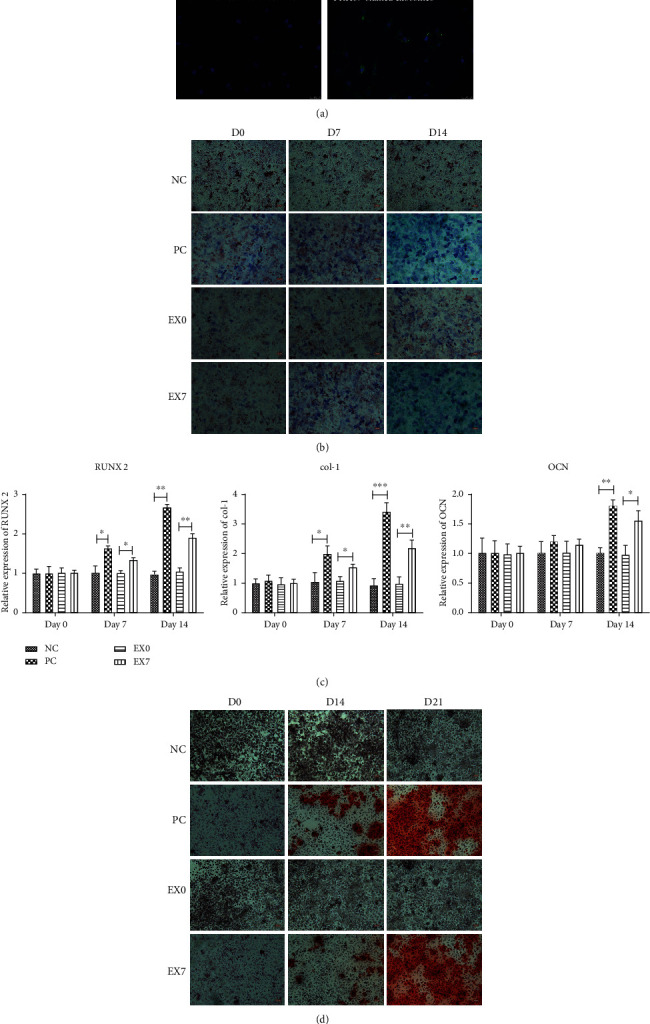
Figure 3.

Evaluation of osteogenic differentiation of DPSCs after exosome treatment. (a) PKH67-stained exosomes were phagocytosed by DPSCs (green); no PKH67-stained signal was found in the negative control; nucleus was stained by DAPI (blue). (b) ALP assay of osteogenesis induction medium groups (PC) and exosome-treated group (EX0 and EX7) cultured at days 0 (D0), 7 (D7), and 14 (D14). (c) The expression levels of RUNX2, col-1, and OCN before and after exosome induction were detected by qRT-PCR. (d) Alizarin red staining of PC group and exosome-treated groups (EX0 and EX7) cultured at days 0 (D0), 7 (D7), 14 (D14), and 21 (D21). NC was the negative control. ∗P < 0.05, ∗∗P < 0.01, and ∗∗∗P < 0.001 indicated significant differences.
