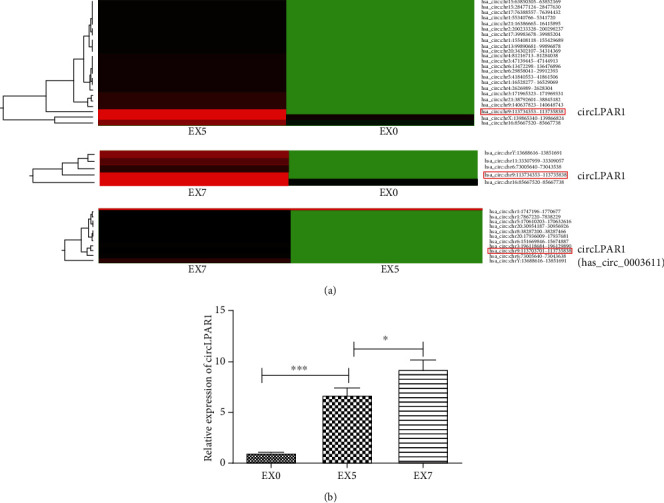
Figure 4.

Exosomal circRNA profiles during osteogenic differentiation of DPSCs. (a) Altered circRNA profiles of exosomes during osteogenic differentiation time intervals (EX0, EX5, and EX7). Red color represented an expression level above the mean, and green color represented expression lower than the mean. (b) The expression level of exosomal circLPAR1 during osteogenic differentiation time intervals (EX0, EX5, and EX7) was detected by qRT-PCR. ∗P < 0.05, ∗∗P < 0.01, and ∗∗∗P < 0.001 indicated significant differences.
