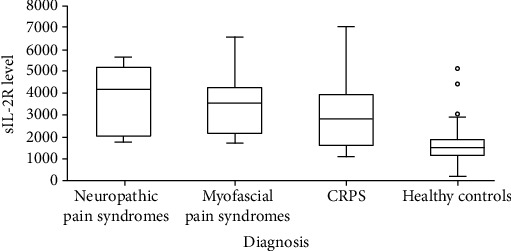
Figure 3.

Boxplot of median sIL-2R levels in the neuropathic pain syndrome group (4170.0 pg/ml; Q3-Q1: 5203.0-2050.0), the myofascial pain syndrome group (3529.0 pg/ml; Q3-Q1: 4253.5-2150.5), the CRPS group (2809.0 pg/ml; Q3-Q1: 3913.0-1589.0), and the group of healthy controls (1515.0 pg/ml; Q3-Q1: 1880.0-1150.0): neuropathic pain syndromes versus controls, p < 0.001 and myofascial pain syndromes versus controls, p < 0.001.
