Figure 2.
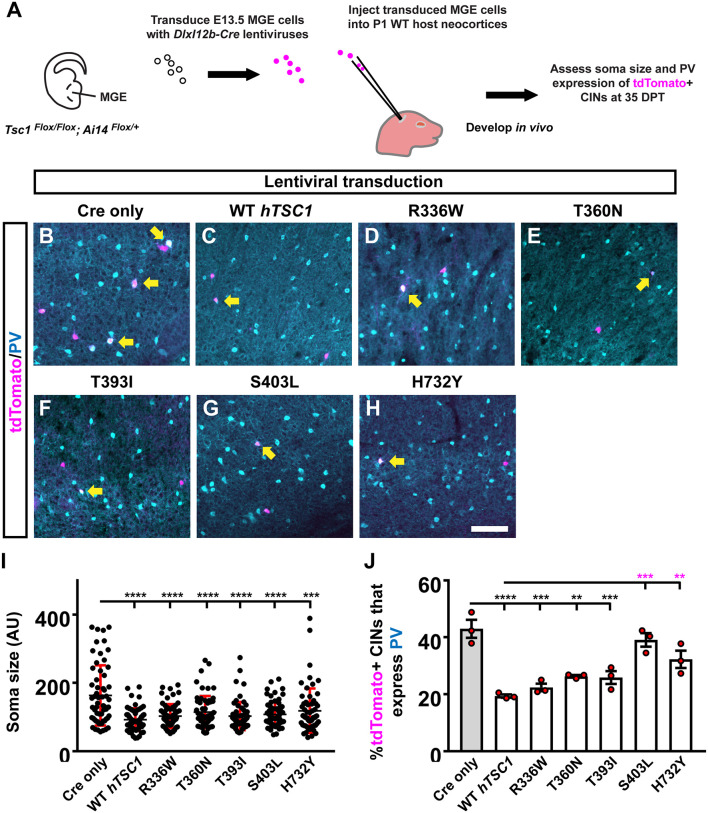
Distinct TSC1 variants impact PV expression but not soma size. Schema depicting the complementation assay. (A) Briefly, TSC1Flox/Flox; Ai14Flox/Flox E13.5 MGE cells were dissociated, transduced with Cre-expressing viruses, transplanted into WT neocortices, and assessed after developing in vivo for 35 days. (B–H) Example immuno-fluorescent images of transplanted cortical interneurons (CINs) in the neocortex co-labeled for tdTomato and parvalbumin (PV). Arrows point to co-labeled cells. (I) Quantification of the soma size for each variant complementation. AU, arbitrary units. (J) Quantification of the %tdTomato+ CINs that express PV. Data are expressed as the mean ± SD for soma size and SEM for PV counts, n = 3 for all groups. For soma size a total of 75 cells were counted for each group and for PV labeling the number of tdTomato+ CINs assessed were: Cre only 454, WT 152, R336W 205, T360N 156, T393I 295, S403L 148, and H732Y 137. **p < 0.01; ***p < 0.001; ****p < 0.0001. Scale bar in (H) = 100 μm.

