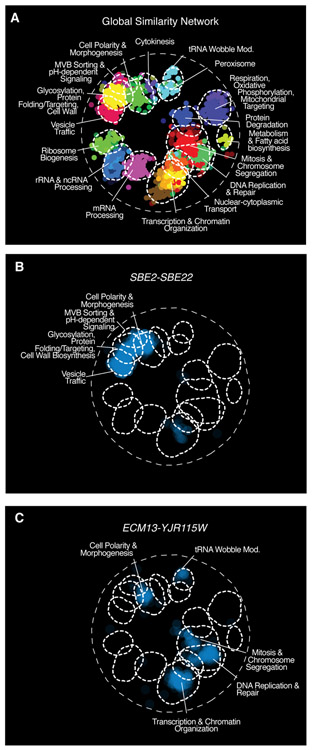
Fig. 5. Trigenic interaction fraction reveals the functional divergence of duplicated genes and illuminates gene function.
(A) SAFE (70) analysis was used to visualize regions of the global digenic interaction profile similarity network (30) that were enriched for genes in the trigenic interaction profiles of the following paralog pairs (B) SBE2-SBE22 and (C) ECM13-YJR115W. Blue indicates the enrichment related to negative trigenic interactions, τ < −0.08, p < 0.05.

