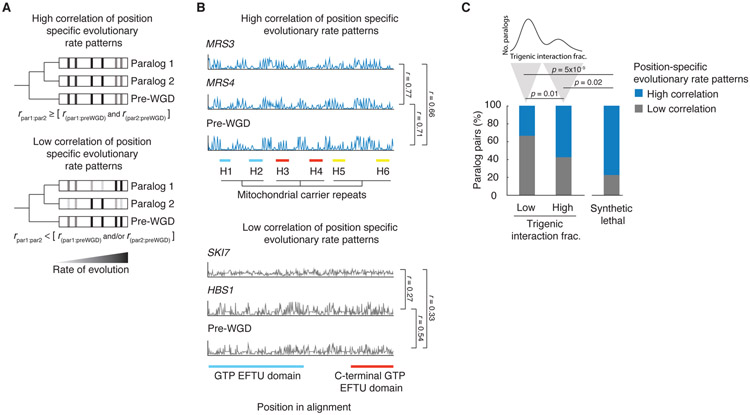
Fig. 6. The evolution of retained overlap due to evolutionary constraints acting on duplicated gene sequences.
(A) Schematic depiction of the analysis of correlated evolutionary sequence changes across paralog sequences reflecting evolutionary constraints on paralogs. Correlated rates of evolution for specific columns in multiple sequence alignments for the pre-WGD homolog and each paralog are denoted with a grey to black gradient, from low to high, respectively. High correlation of position specific evolutionary rate patterns identify residues with similar evolutionary constraints. Paralogs with correlated rates (r par1:par2) that are greater than or equal to that of each paralog and with the corresponding preWGD (r par1:preWGD and r par1:preWGD ) were designated as having a high correlation of position specific evolutionary rate pattern, and paralogs with correlated rates (r par1:par2) that were less than that of either paralog or both paralogs with the preWGD (r par1:preWGD and/or r par1:preWGD ) were designated as having a low correlation of position specific evolutionary rate pattern. r refers to the Pearson correlation coefficient between the respective sequences. (B) Examples of evolutionary rates for positions in the alignments for representative paralogs, which show a high correlation of position-specific evolutionary rate patterns (MRS3-MRS4) and a low correlation of position-specific evolutionary rate patterns (SKI7-HBS1). The position in the alignment is plotted on the x-axis and the rate of evolution at a particular position divided by the average rate of evolution for all residues in the given sister paralog is plotted on the y-axis. The scale of the y-axis has been fixed for each paralog pair. Pfam domains are annotated. The MRS3-MRS4 alignment shows three mitochondrial carrier repeats, each composed of two α-helices (H1&H2 (blue), H3&H4 (red), H5&H6 (yellow)) followed by a characteristic motif PX[D/E]XX[K/R]X[K/R](20-30 residues)[D/E]GXXXX[W/Y/F][K/R]G connecting each pair of membrane-spanning domains by a loop. SKI7-HBS1 alignment shows GTP EFTU (blue) and C-terminal GTP EFTU (red) domains. The Hbs1-like N-terminal motif lies outside of the alignment window. (C) Fraction of nonessential and essential paralogs that show a high or low correlation of position-specific evolutionary rate patterns. The paralogs with low and high trigenic interaction fraction belong to the part of the distribution shown above; trigenic interaction fraction cut-off of 0.4 was used based on negative interactions score (τ or ε) < −0.08, p < 0.05 and contains the set of paralogs that were used for the correlated evolution analysis. Significance was assessed with Fisher’s exact test.

