
Figure 4.
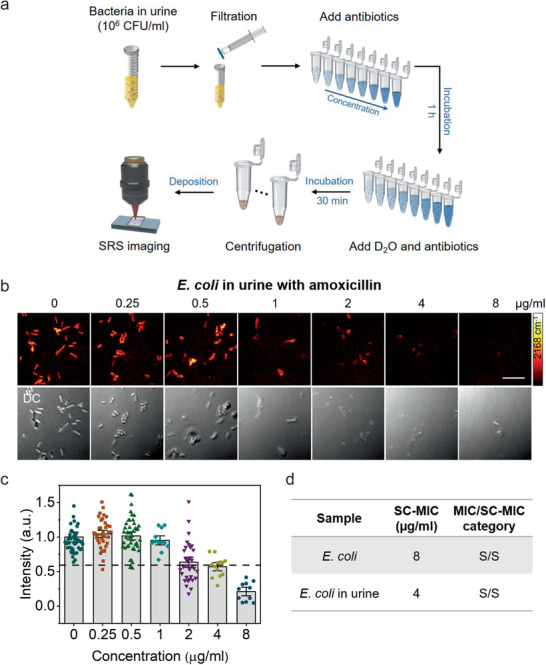
SC‐MIC determination after 1 h culture of E. coli in urine. a) Bacterial purification protocol for bacteria in urine for rapid AST by SRS imaging of D2O metabolic incorporation. b) SRS and corresponding transmission images of E. coli in urine after 1 h culture in D2O‐containing medium with the addition of serially diluted amoxicillin. c) Statistical analysis of C–D intensity in bacteria in (b). Number of cells N ≥ 10 per group. The colored points under different concentration stand for different individual bacterium. The dotted lines indicate the cutoff value at 60% of the control sample. The C–D intensities are normalized to the mean of control without antibiotic treatment. Number of cells N ≥ 10 per group. Error bars represent the SEM. Scale bar: 10 µm. d) The comparison of SC‐MIC and the CLSI susceptibility category for E. coli isolate and E. coli in urine. S: sensitive.