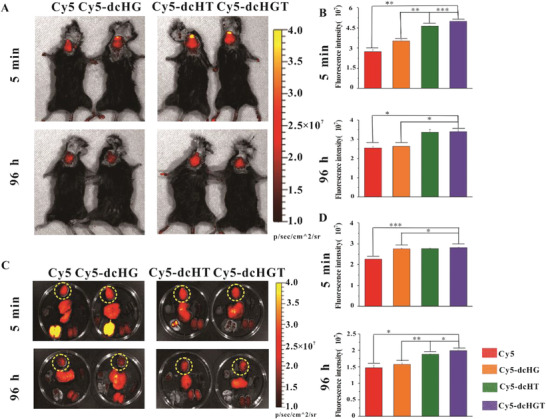
Figure 5.

In vivo imaging of Cy5‐dcHGT NPs in AD mice. A) In vivo fluorescence imaging and B) quantitative fluorescence analysis at 5 min and 96 h after nasal administration of Cy5, Cy5‐dcHG NPs, Cy5‐dcHT NPs, and Cy5‐dcHGT NPs (n = 3 per group). C) Ex vivo fluorescence imaging and D) quantitative fluorescence analysis at 5 min and 96 h after administration (brains are marked with a yellow dotted circle). Data are presented as the mean ± SD. *P < 0.05, **P < 0.01, and ***P < 0.001.
