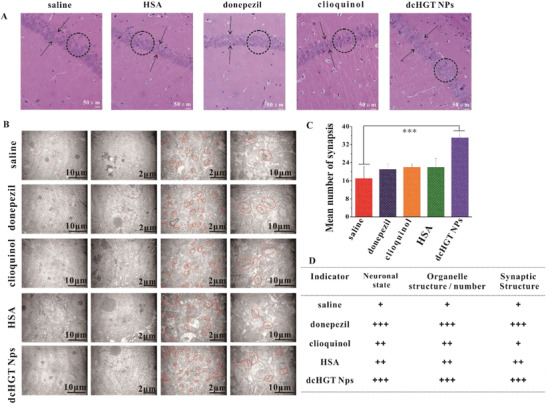
Figure 8.

Morphological studies of dcHGT NPs’ neuroprotective effects. A) H&E staining of the dentate gyrus region in saline, donepezil, clioquinol, HSA, and dcHGT NP groups. The cell layers are indicated by arrowheads, and the circles contain the characteristic arrangement of cells. Scale bar: 50 µm. B) TEM observation of hippocampal ultrastructure in the five groups. C) Quantitative analysis of synapse number in five groups. D) Evaluation of the nerve cells’ overall morphology and activity in the hippocampus of the five groups. Data are presented as the mean ± SD.***P < 0.001.
