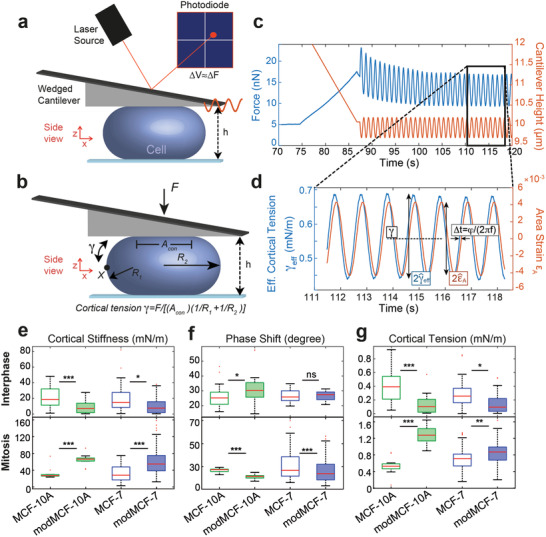
Figure 2.

Mechanical phenotyping of the actin cortex of MCF‐7 and MCF‐10A before and after EMT measured by dynamic AFM cell confinement. a) Schematic of measurement setup: initially round cells (mitotic cells or suspended interphase cells) are confined by the tip of a wedged AFM cantilever and oscillatory height oscillations are imposed. b) Mechanical and geometrical parameters of a measured cell used for data analysis. c) Exemplary AFM readout during cell confinement and subsequent oscillatory cell height modulation: force (blue), cantilever height (orange). d) Effective time‐dependent cortical tension estimate (blue) and relative cell surface area change (orange) from data analysis of the indicated time window in (c). Mechanical parameters are determined as follows: cortex stiffness K is calculated as , phase shift is obtained as ϕ = (2πf)Δt, cortical tension is calculated as time average of γ eff (dashed black line). The corresponding complex elastic modulus of the cortex is K* = Ke iϕ. e) Cortical stiffness, f) phase shift, and g) cortical tension measured for suspended interphase cells (top row) and cells in mitotic arrest (bottom row) before and after EMT. (Post‐EMT cells are referred to as modMCF‐7 and mod‐MCF‐10A, respectively. Number of cells measured: Interphase: MCF‐7 n = 27, modMCF‐7 n = 28, MCF‐10A n = 27, modMCF‐10A n = 31, Mitosis: MCF‐7 n = 34, modMCF‐7 n = 45, MCF‐10A n = 12, modMCF‐10A n = 12. Measurements are representative for three independent experiments. ns p > 0.05, *p < 0.05, **p < 0.01, ***p < 0.001).
