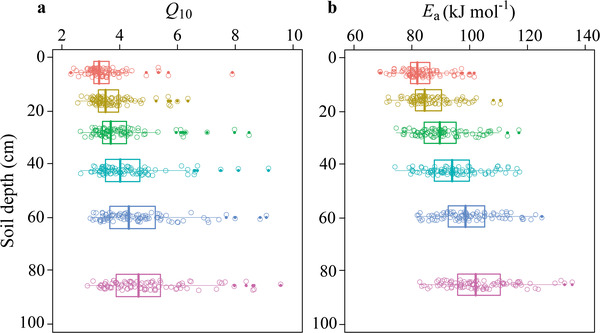
Figure 2.

Temperature sensitivity increases with soil depth across China's forests. Box plots of a) the temperature sensitivity of soil organic carbon decomposition (Q 10) and b) activation energy (E a) with soil depth. Lines in boxes represent median, left and right of boxes represent first and third quartiles; dots represent single observations. Linear mixed‐effects models are used to evaluate the effect of soil depth on Q 10 and E a excluding autocorrelations of different sampling sites and depths, showing that Q 10 and E a significantly increase with soil depth (P < 0.001). N = 90 for each soil depth.
