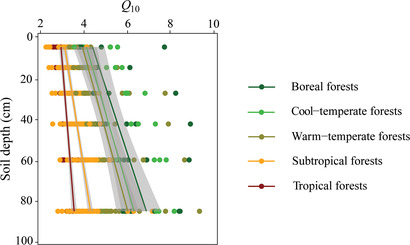
Figure 3.

The temperature sensitivity of soil organic carbon decomposition (Q 10) with soil depth among biome types. Shaded areas indicate the 95% confidence intervals for each biome type. Linear mixed‐effects models are used to evaluate the effect of soil depth on Q 10 with excluding autocorrelations of different sampling sites and depths, showing that Q 10 for each biome type significantly increases with soil depth (P < 0.001).
